
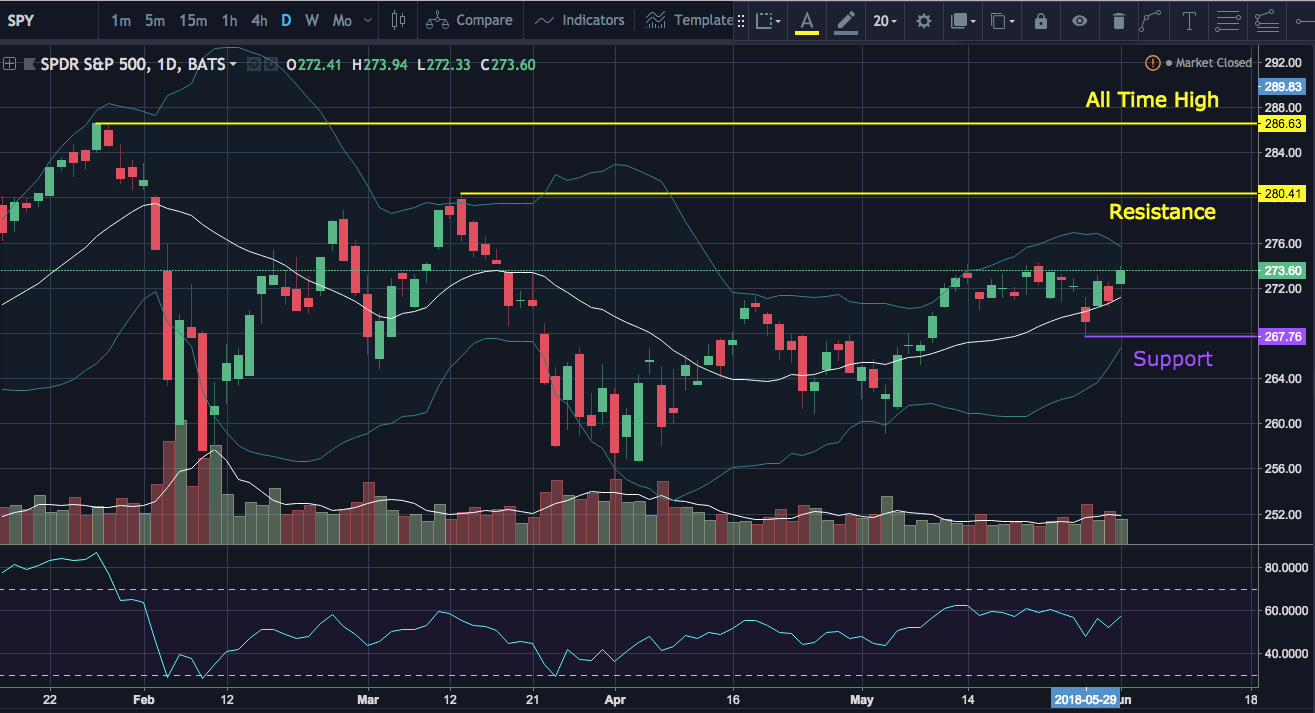
SPY has pulled back from the $274 level again on Friday. We have been trading between $274 and $267 for the last 15 days now. If the bulls can break above $280.41 that would be the last major resistance before all time high levels.
Looking at the tech sector index fund XLK you can see that it is already near all time highs as the cup and handle pattern that we have been watching is about to confirm with a bullbreak of $71.34
XLK Technology Sector Weekly Chart:
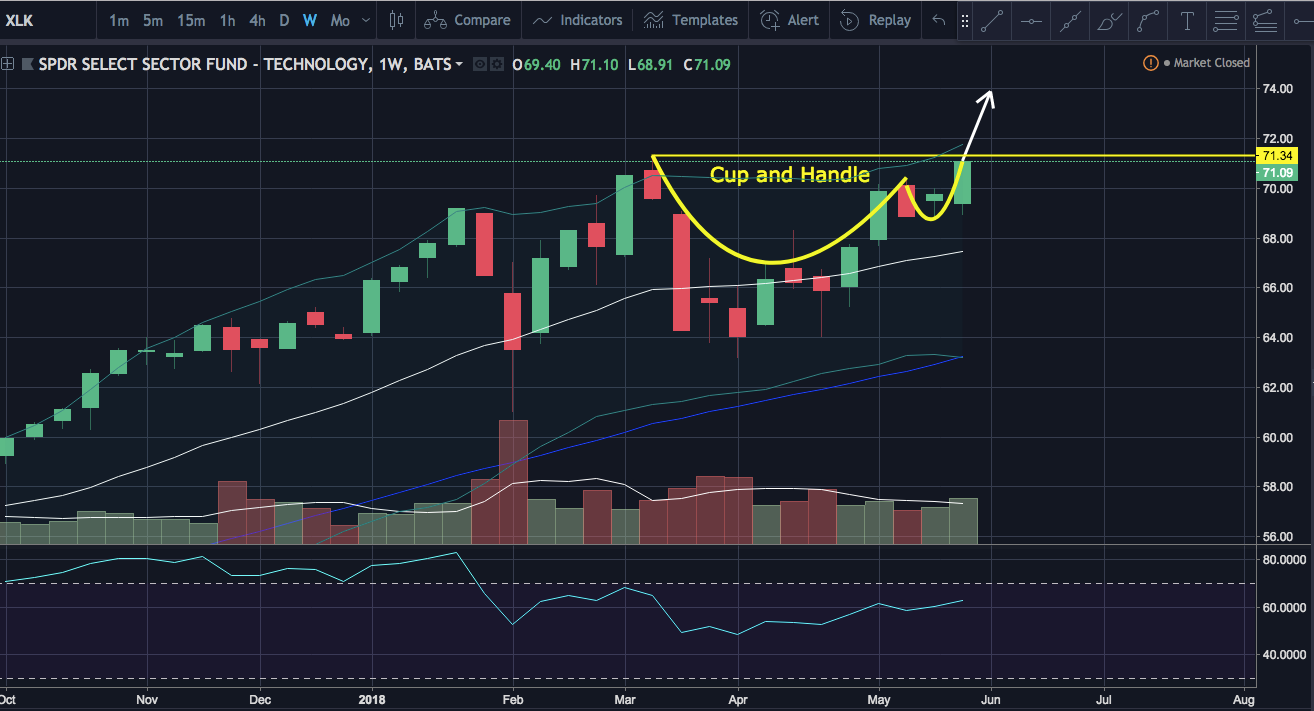
XLK Technology Sector Weekly Chart:
The financial sector has been bearish holding SPY (S&P) back. Looking at the financial sector index fund XLF we can see that it has maintained the support of its 50 week moving average. The financial sector will need to break above the middle Bollinger ban (20MA) on the weekly chart to see more upside potential as the 50 period MA support and the middle Bollinger band resistance get tighter.
XLF Financial Sector Weekly Chart:
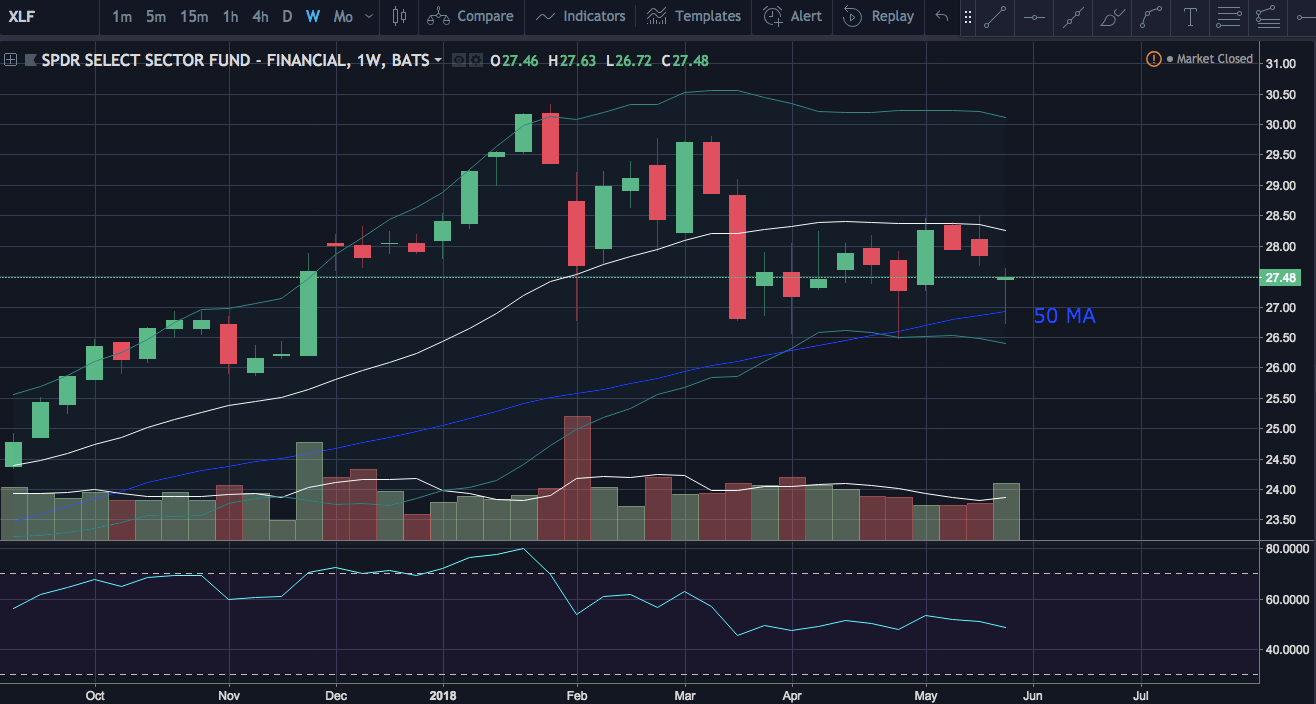
XLF Financial Sector Weekly Chart:
QQQ, the index fund that tracks the Nasdaq 100, has pretty much the same setup as XLK with the bulls trying to confirm the cup and handle pattern and back to all time highs. A break of $175.21 would confirm the cup and handle.
QQQ Weekly Chart:
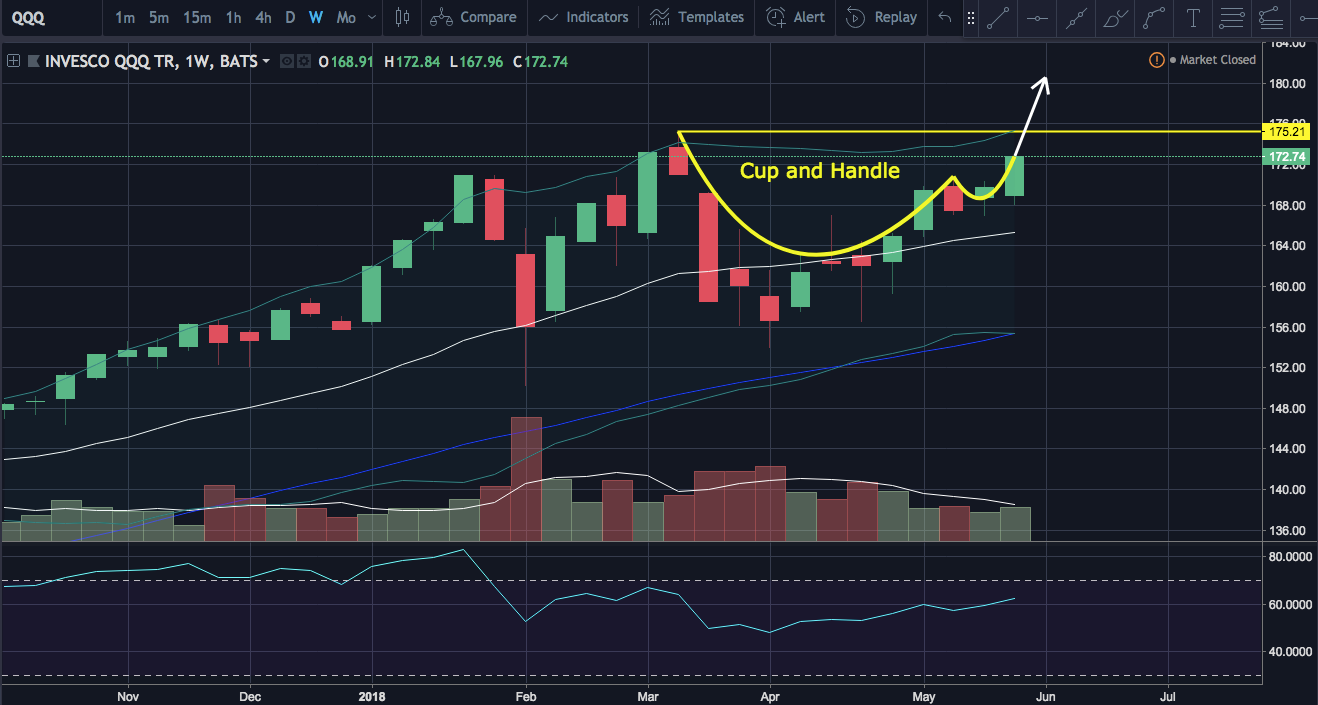
QQQ Weekly Chart:
Looking at the index fund for the Russell 2000 small caps IWM we can see that it has been the leader as it has already broken to all time highs. It has however seen resistance several times from the weekly upper Bollinger band. IWM has consolidated the last three days pulling back from $164.39. If the bulls can break this level it should have room to run at least to the weekly upper bollinger band before meeting resistance this week.
IWM Weekly Chart:
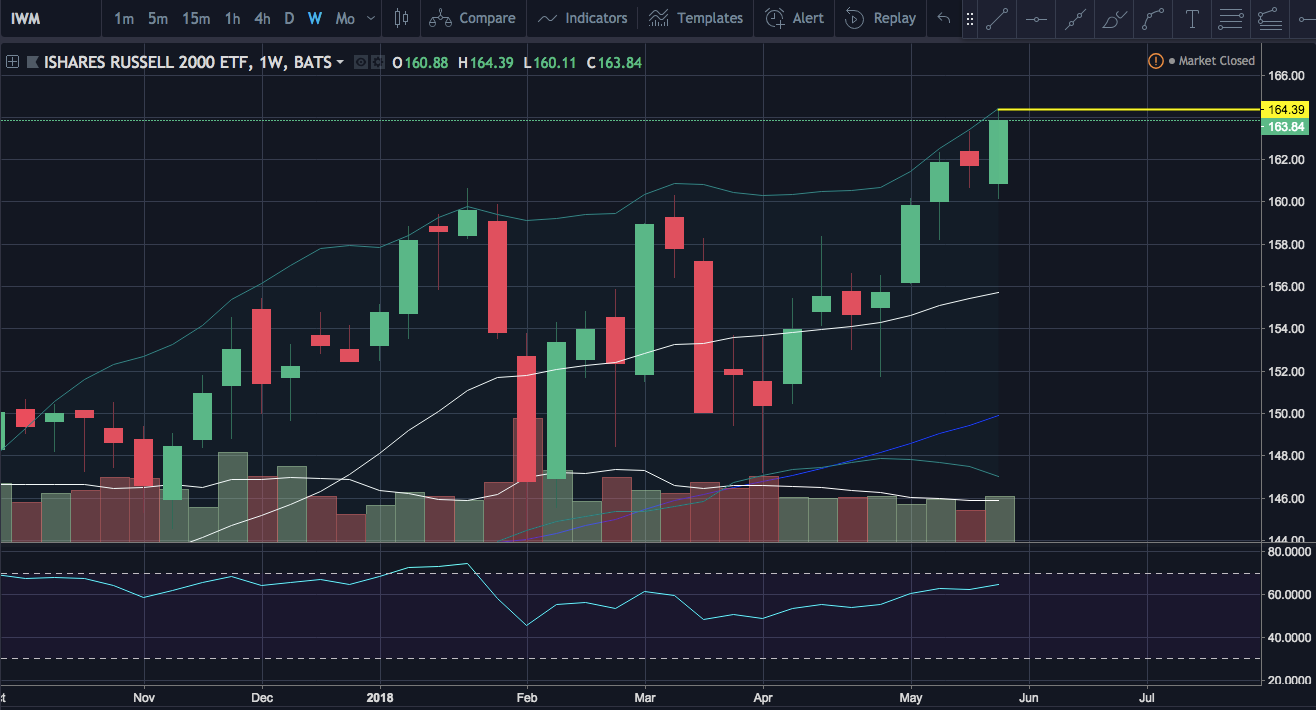
IWM Weekly Chart: