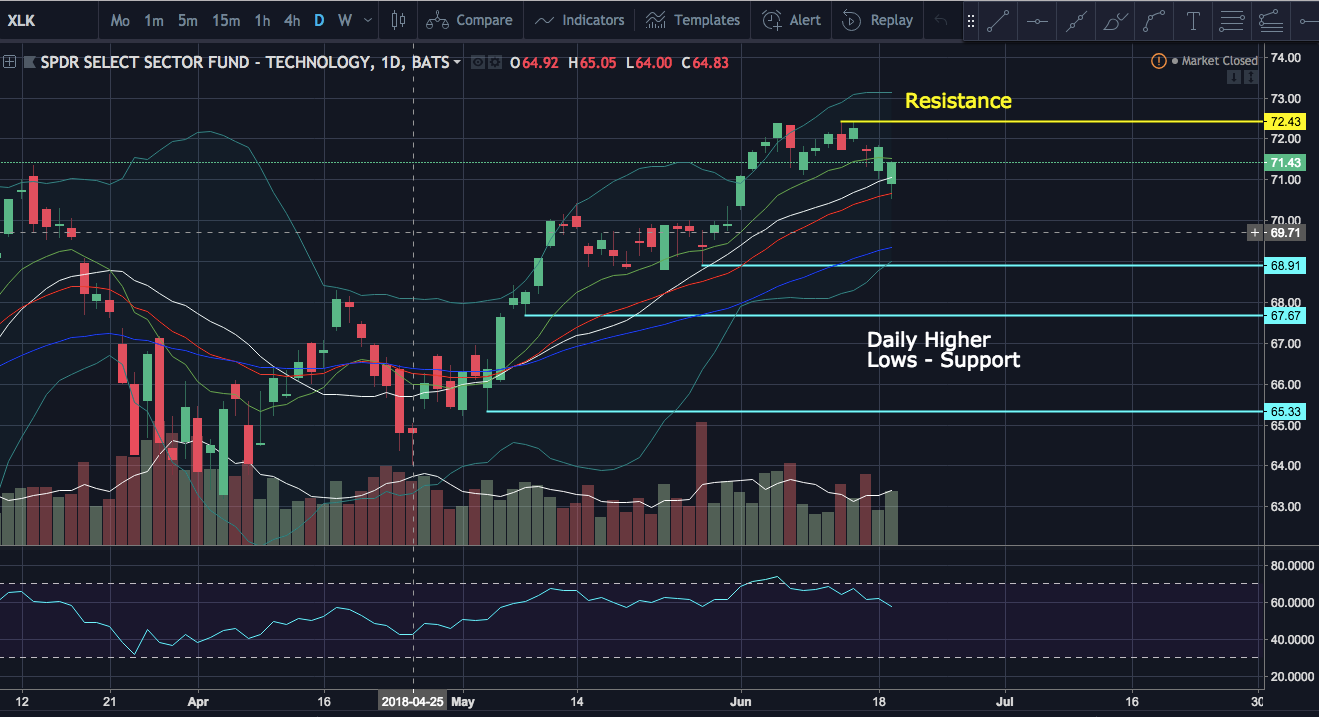
SPY (S&P 500) The market dipped today due to the tariff news, but the bulls once again bought the dip. On the weekly chart it looks like healthy consolidation and a possible bull flag.
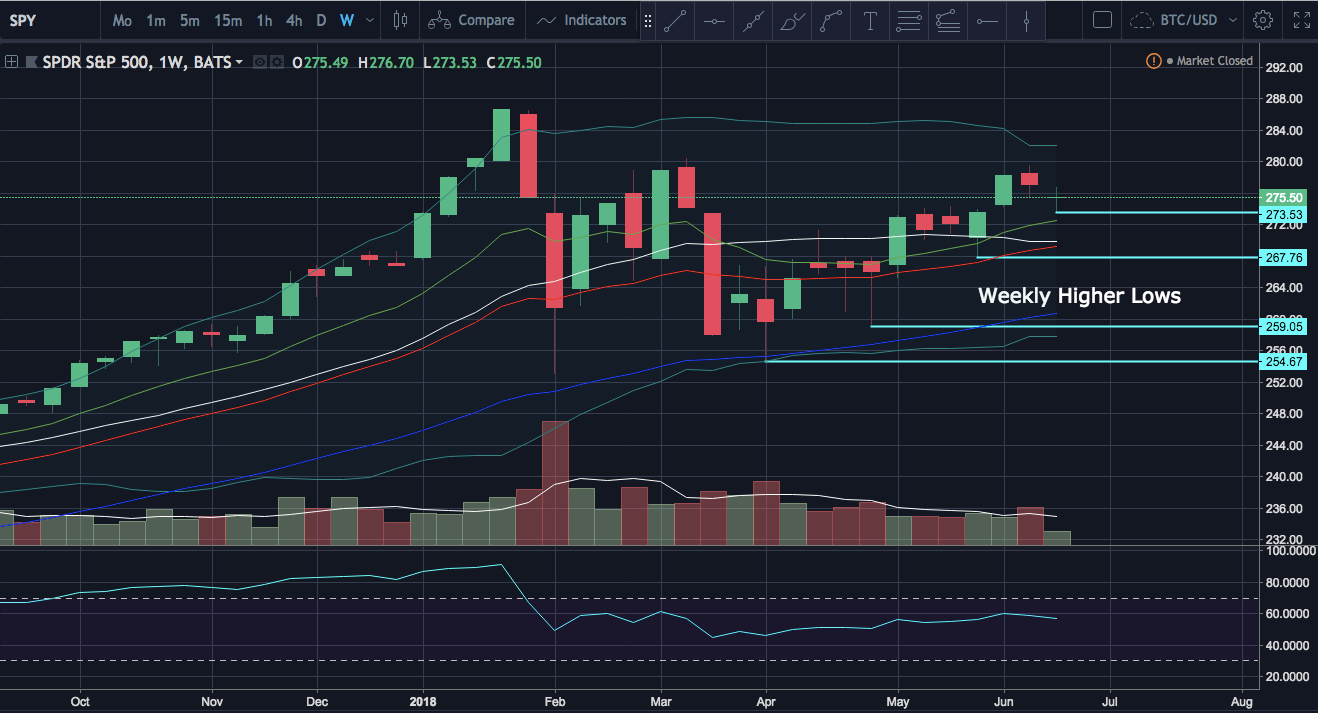

On the daily chart SPY opened lower today than yesterday and the bulls ran to form a green candle closing near the high of the day. The bulls will be looking to break the lower low pattern we have seen the last three days. Anything above $267.76 is still a higher low on the daily chart.
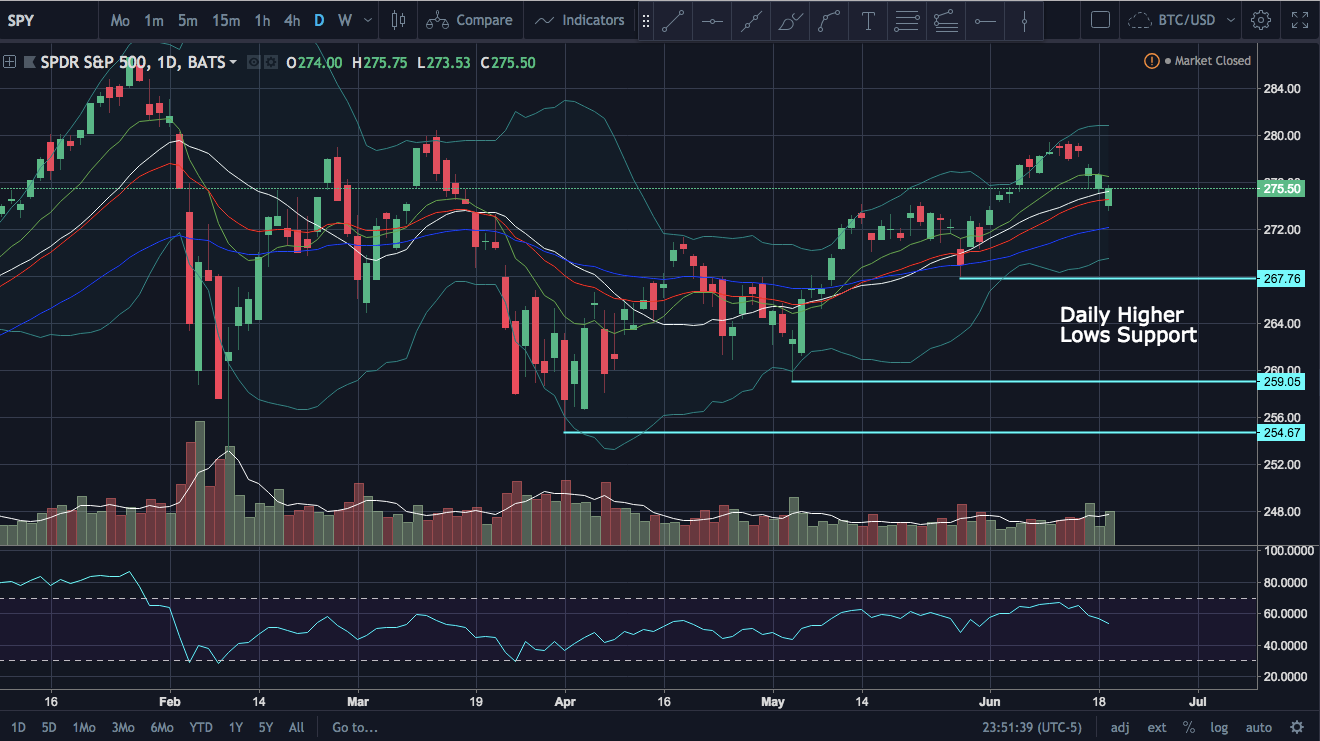

On the hourly time frame there is a clear downtrend with lower lows and lower highs. We will need to see a higher low and higher high on this timeframe to change the trend. We will then look to do the same on the 4 hour and daily time frames.

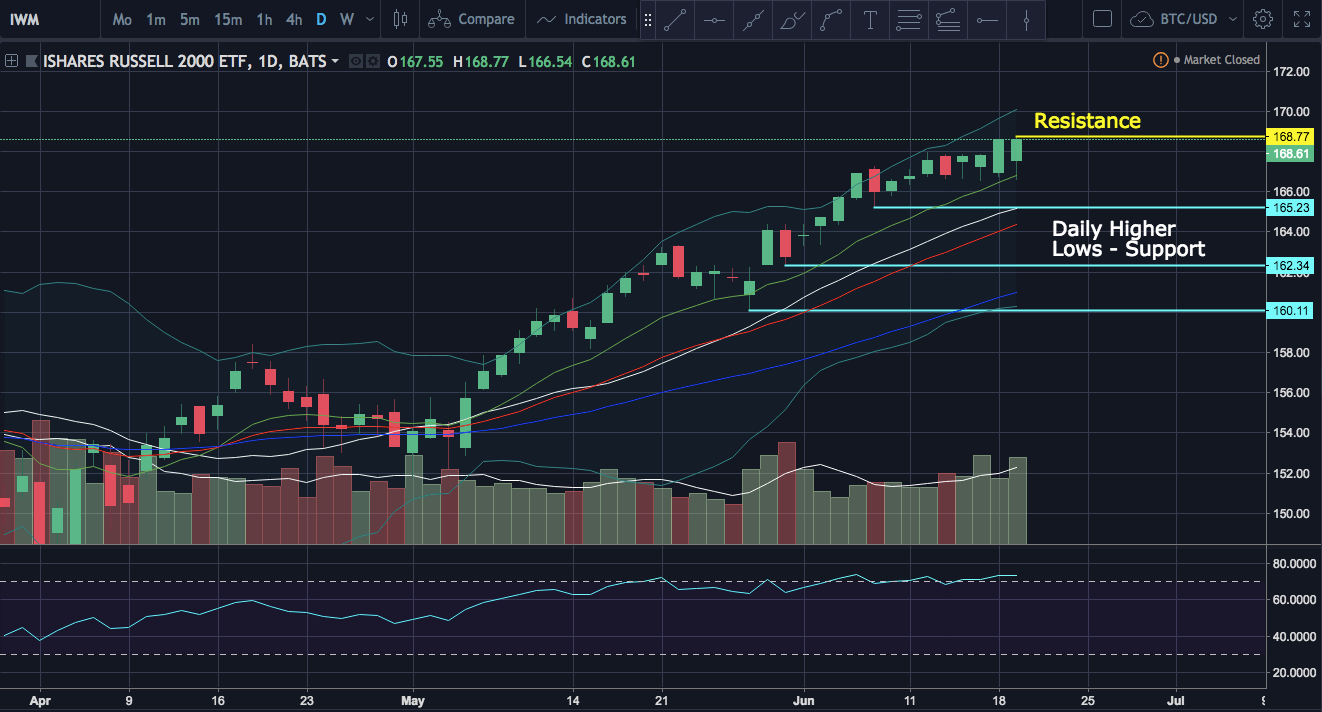
IWM (Russell 2000) The bulls are in full control after breaking strong from the weekly equilibrium pattern. $168.77 is the new all time high. The bulls have now had 7 straight weeks of breaking new all time highs.

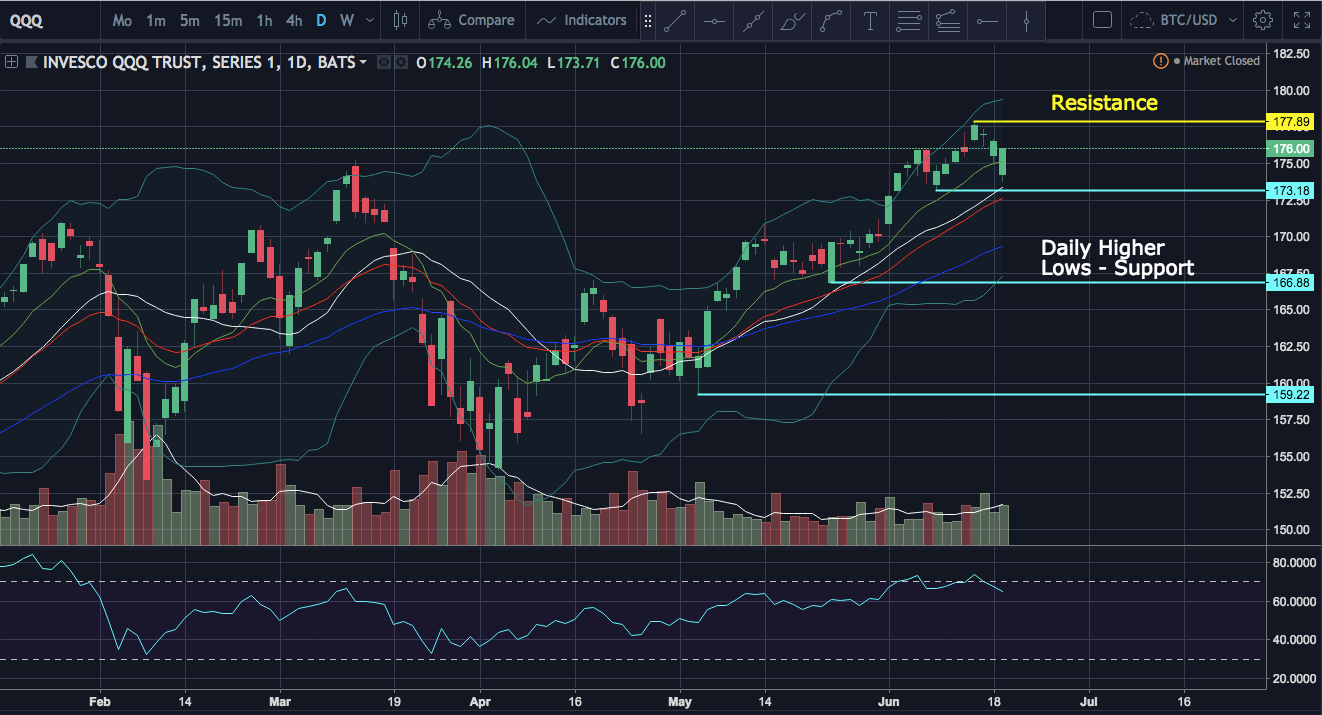
QQQ (Nasdaq 100) The bulls bought the dip today. On the weekly chart we have slight consolidation from the all time high. We still have a higher lows on the daily chart, the last being at $172.81 and another at $173.71 on todays candle. In order to head back to all time highs ($177.51) the bulls will first need to break the lower high pattern that we have had for three days now.

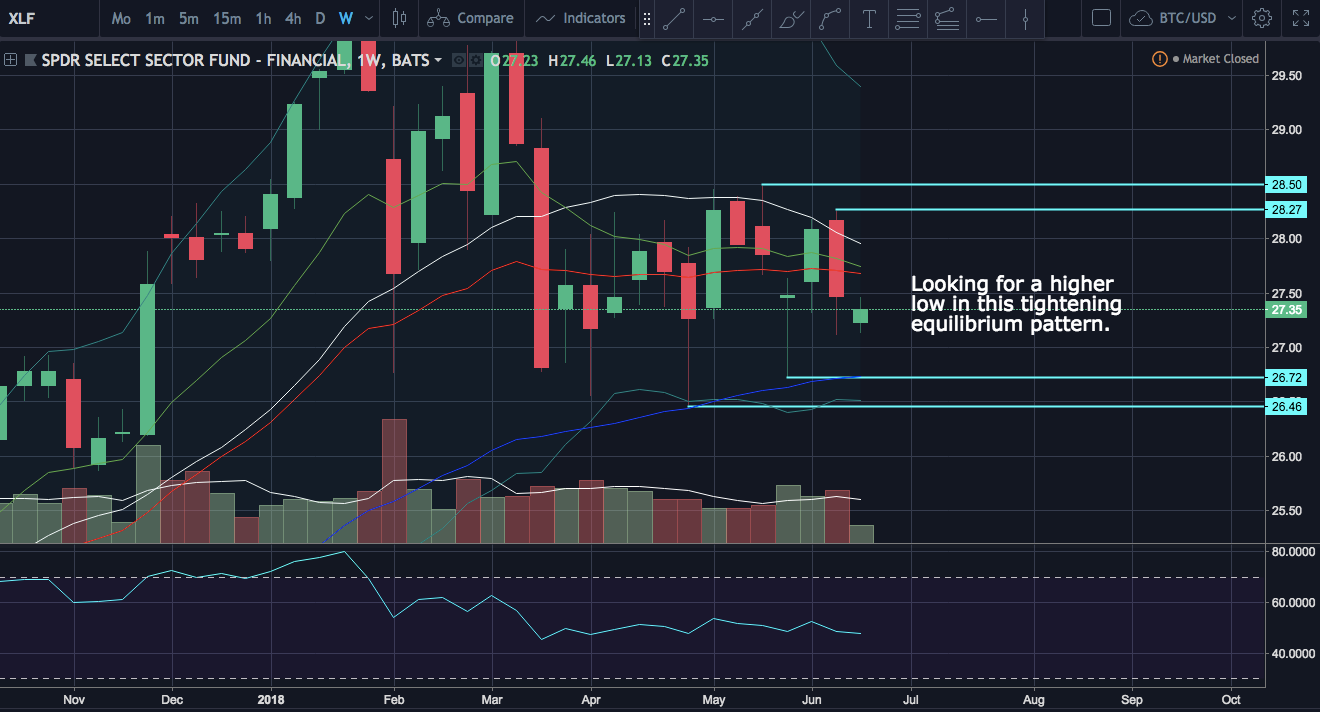
XLF (Financial Sector) The financial sector is in a weekly tightening equilibrium pattern and looking to set a higher low somewhere above $26.72. The bulls are trying to build a base of support in order to move higher as this sector has been the laggard in the S&P holding it back.

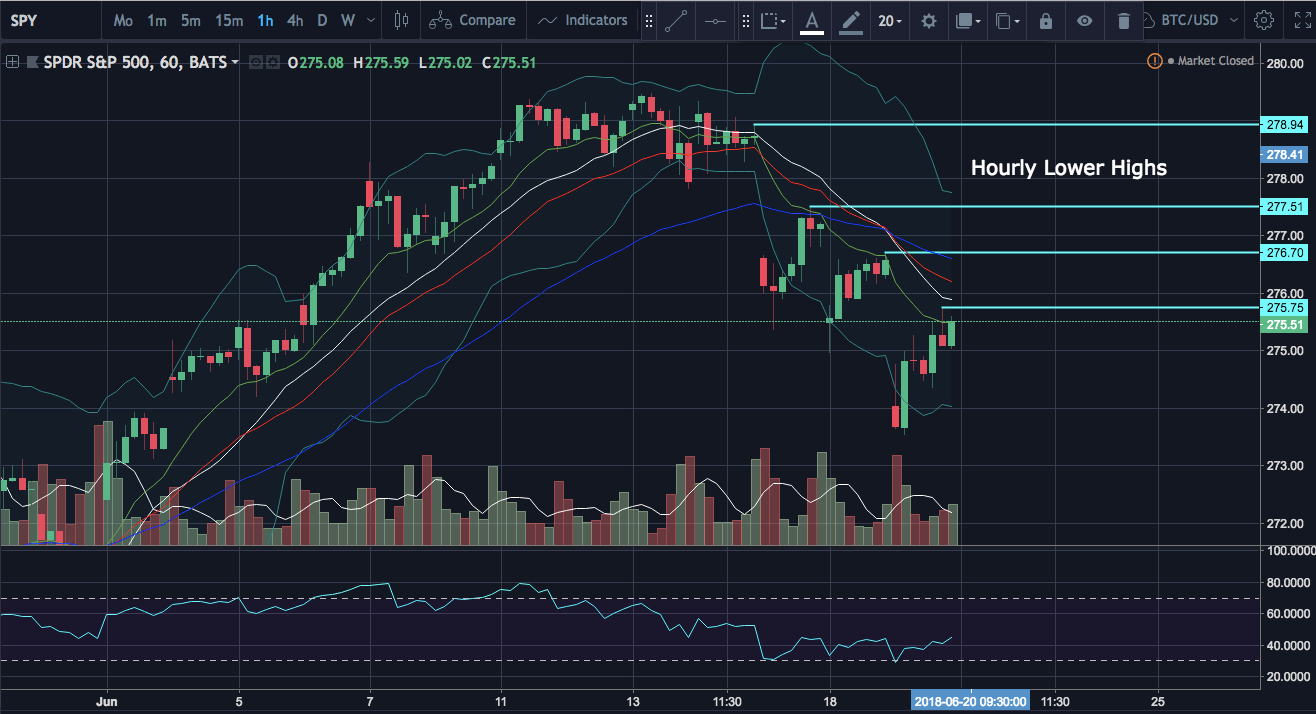
XLK (Technology Sector) The tech sector has consolidated for the last three days after a double top at the all time high of $72.43. Each day the bulls have bought the dip and the consolidation has not stopped some names from reaching all time highs such as Netflix today. If we set a lower high anywhere above $68.91 it will be a higher low on the daily chart and the bulls will remain in full control.
