
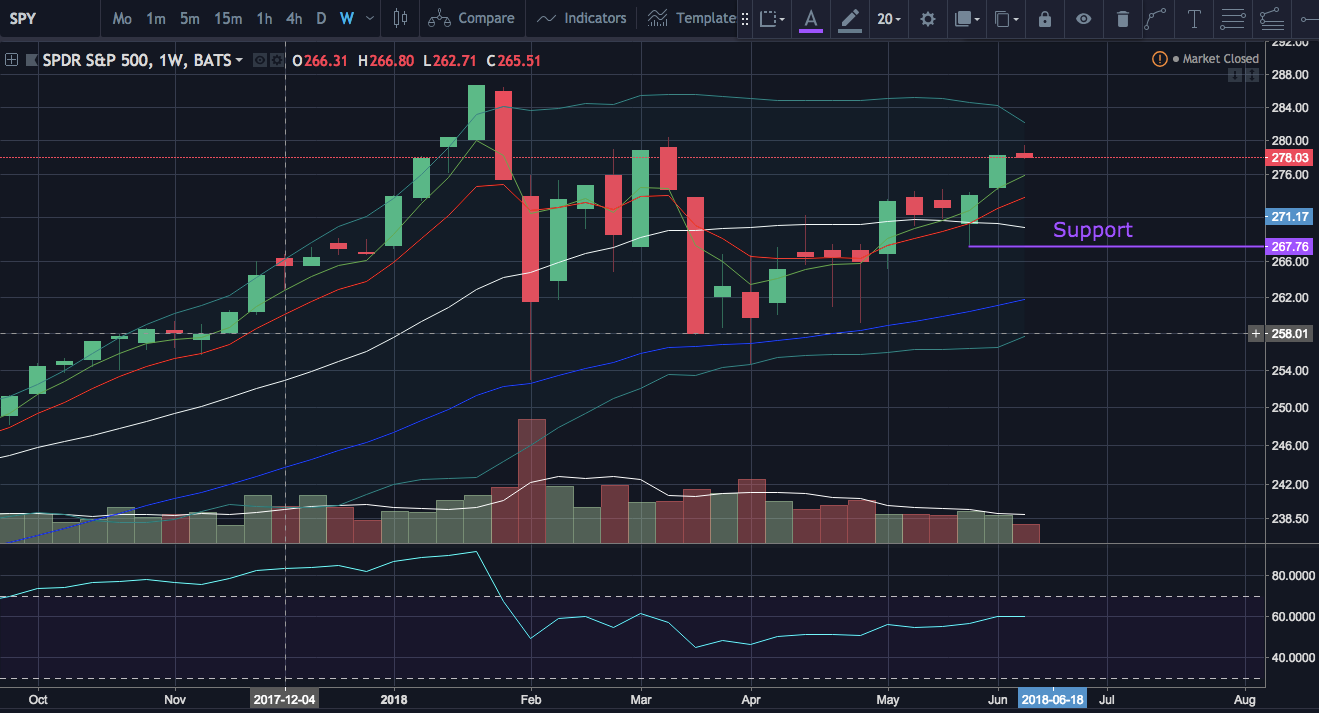
SPY (S&P 500)
SPY had a bearish reaction to the FOMC report Wednesday and closed near the low of the day. We have a triple top on the daily chart at about $279.48. We have EMA supports to look at and then the middle bollinger band (20MA). Anything above $267.76 is a higher low on the weekly time frame. Keep an eye out for gaps to fill on the weekly and hourly charts. at $273.94
SPY had a bearish reaction to the FOMC report Wednesday and closed near the low of the day. We have a triple top on the daily chart at about $279.48. We have EMA supports to look at and then the middle bollinger band (20MA). Anything above $267.76 is a higher low on the weekly time frame. Keep an eye out for gaps to fill on the weekly and hourly charts. at $273.94
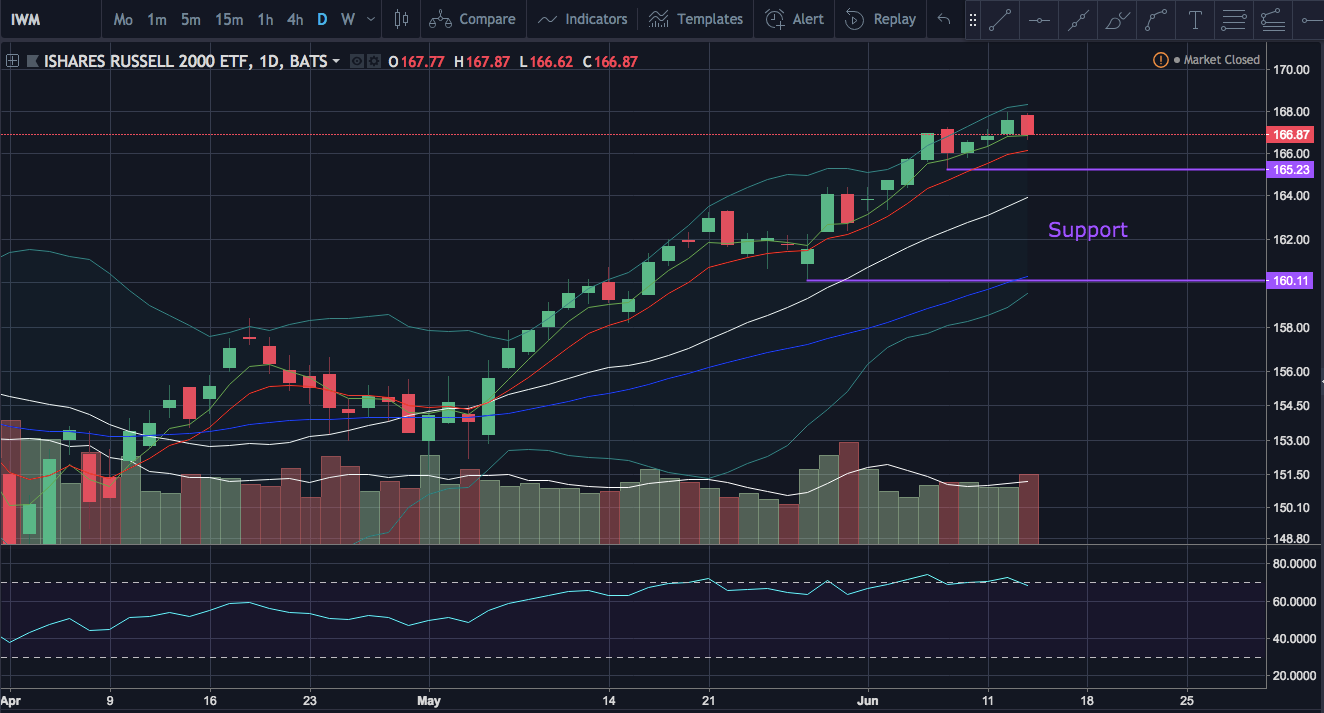
IWM (Russell 200)
IWM was unable to break to all time high’s today and pulled back to break the low of yesterday. Keeping an eye on the last higher low of $165.23. On the weekly chart there is quite a bit of room to consolidate since the last higher low at $160.11
IWM was unable to break to all time high’s today and pulled back to break the low of yesterday. Keeping an eye on the last higher low of $165.23. On the weekly chart there is quite a bit of room to consolidate since the last higher low at $160.11
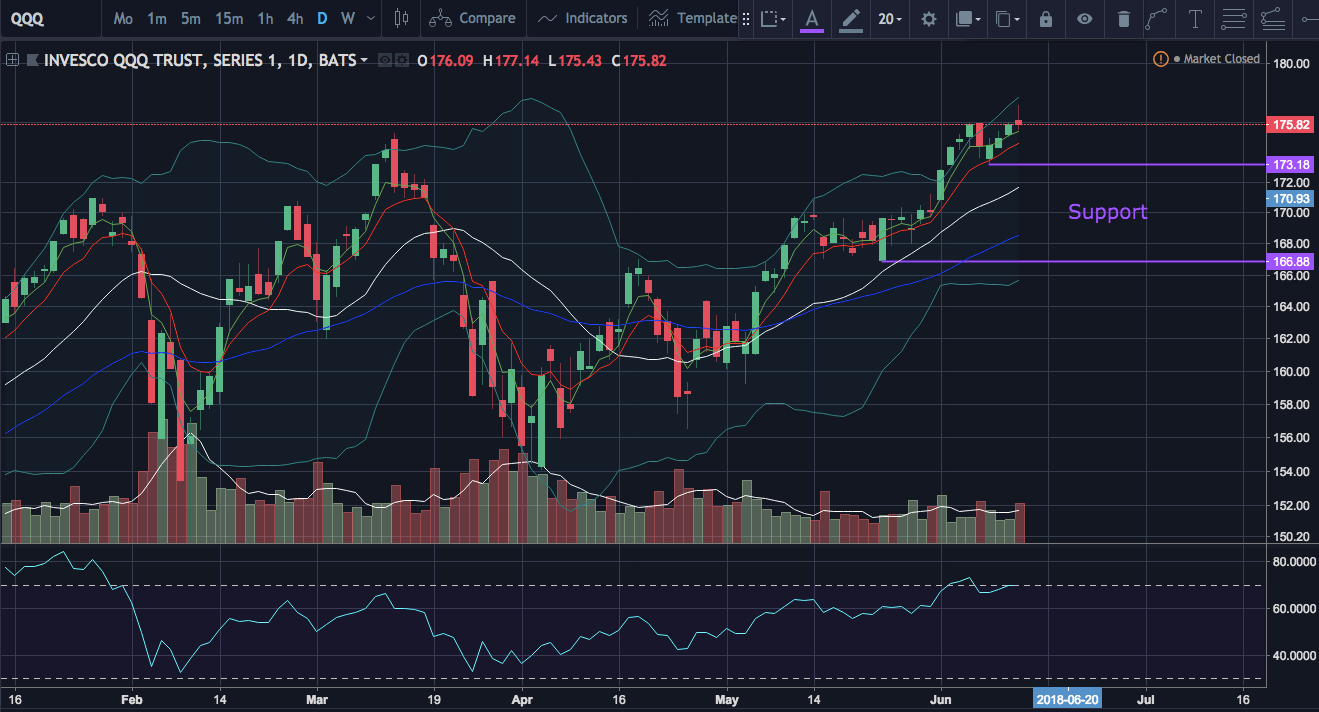
QQQ (Nasdaq 100)
QQQ has a bearish reversal candlestick with a big upper wick of profit taking. The last daily higher low is at $173.18. Any consolidation above that level will keep the bulls in control of the daily time frame. Anything above $166.88 will be a higher low on the weekly chart.
QQQ has a bearish reversal candlestick with a big upper wick of profit taking. The last daily higher low is at $173.18. Any consolidation above that level will keep the bulls in control of the daily time frame. Anything above $166.88 will be a higher low on the weekly chart.
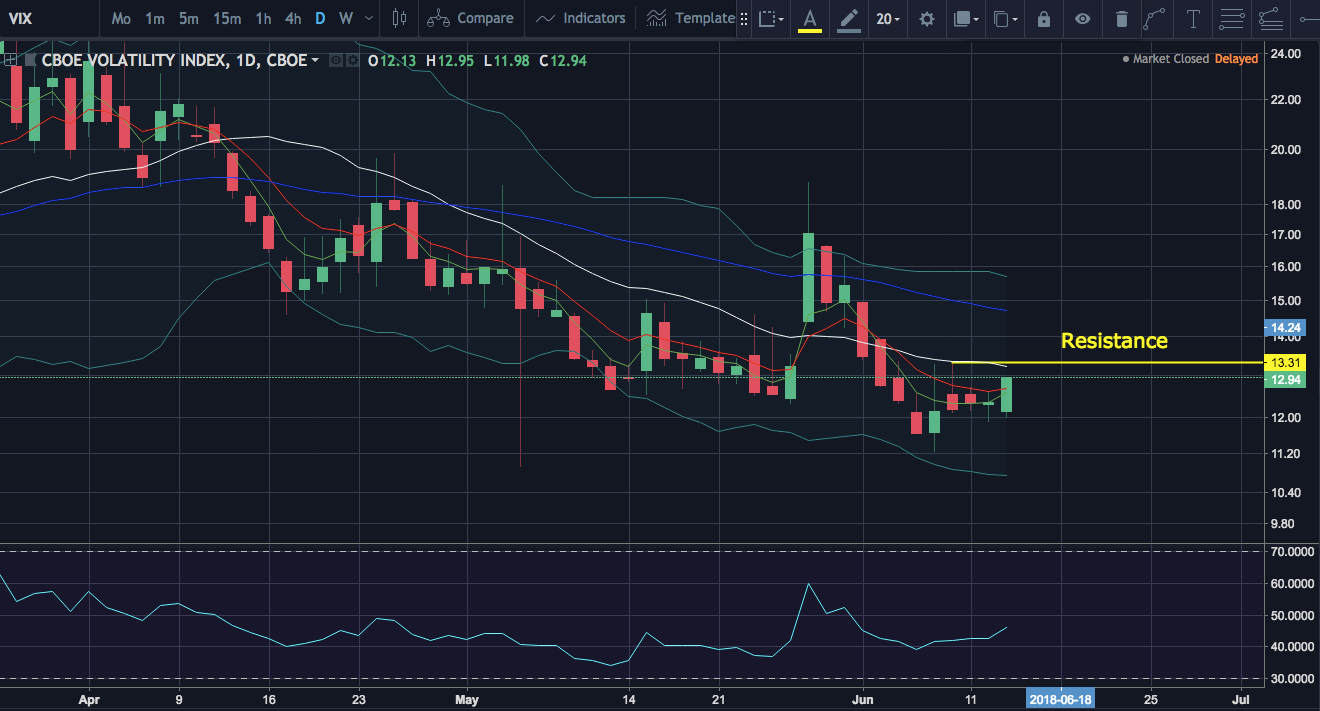
VIX (Volatility Index)
VIX bulls closed near the high of the day Wednesday. 13.31 is the next resistance to be looking at. The bulls will try now to make a higher high above that level.
VIX bulls closed near the high of the day Wednesday. 13.31 is the next resistance to be looking at. The bulls will try now to make a higher high above that level.
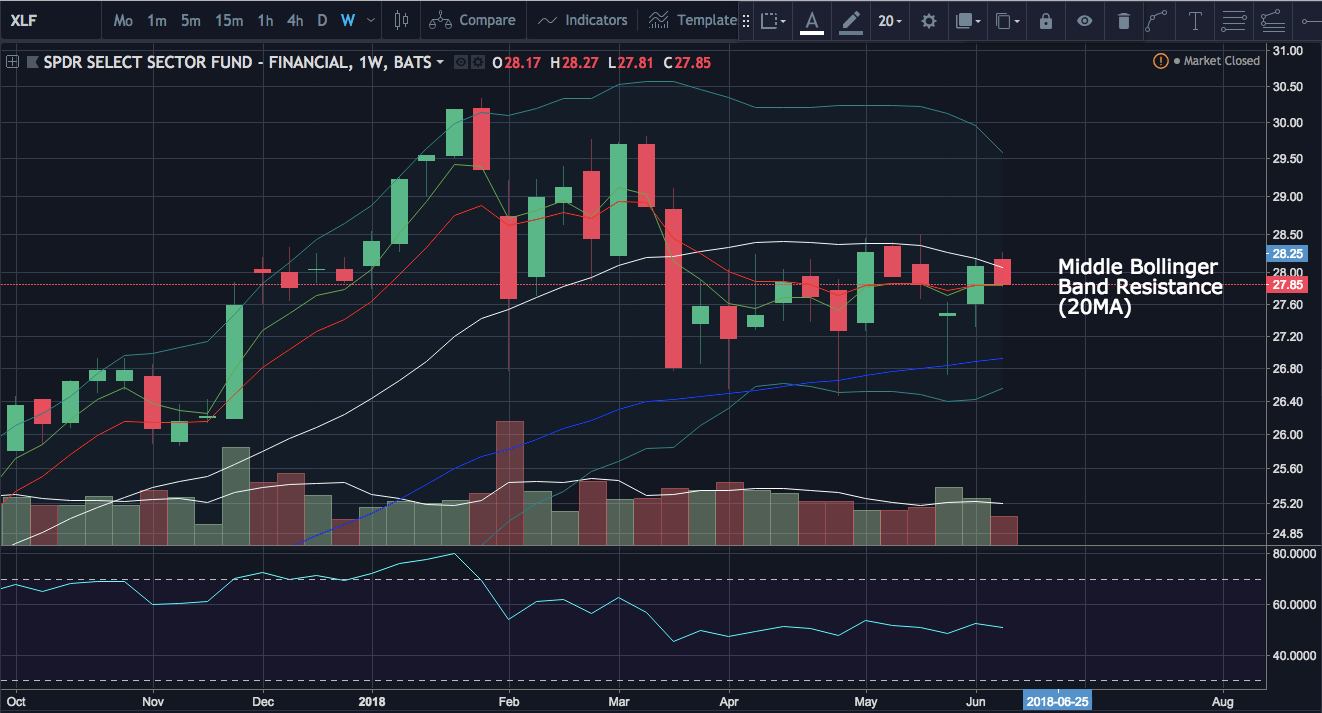
XLF (Financial Sector)
The financial sector is still having a hard time breaking the resistance of the weekly middle bollinger band. We will look for more consolidation on the weekly time frame before another possible test to try and break that resistance. More extreme consolidation could see a loss of the higher low pattern on the weekly time frame.
The financial sector is still having a hard time breaking the resistance of the weekly middle bollinger band. We will look for more consolidation on the weekly time frame before another possible test to try and break that resistance. More extreme consolidation could see a loss of the higher low pattern on the weekly time frame.