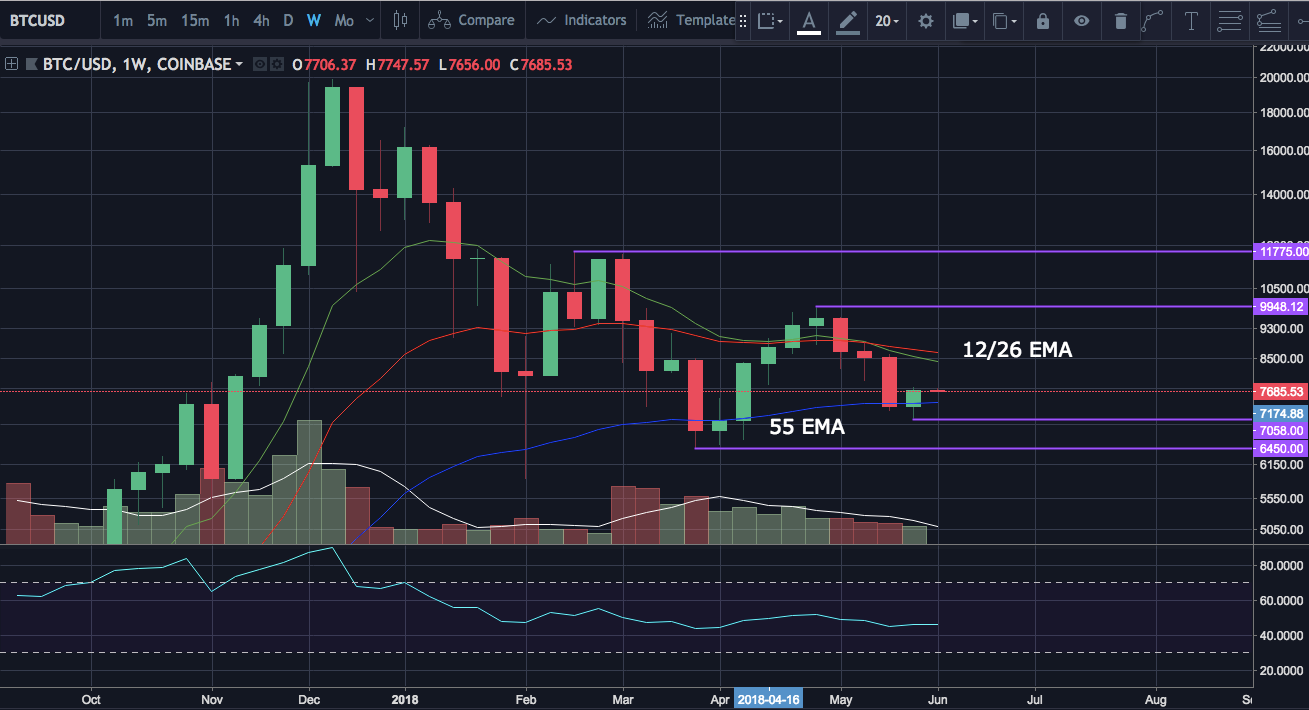
The Bitcoin bulls are now trying to set the higher low in the weekly equilibrium pattern that we have been watching after four days of green candles. This saw the week close with a bullish reversal candle. If the bulls can followthrough we will look for a higher high to be set in this equilibrium pattern somewhere below the previous one at $9,948.12 as the price gets tighter and tighter
Weekly Chart:
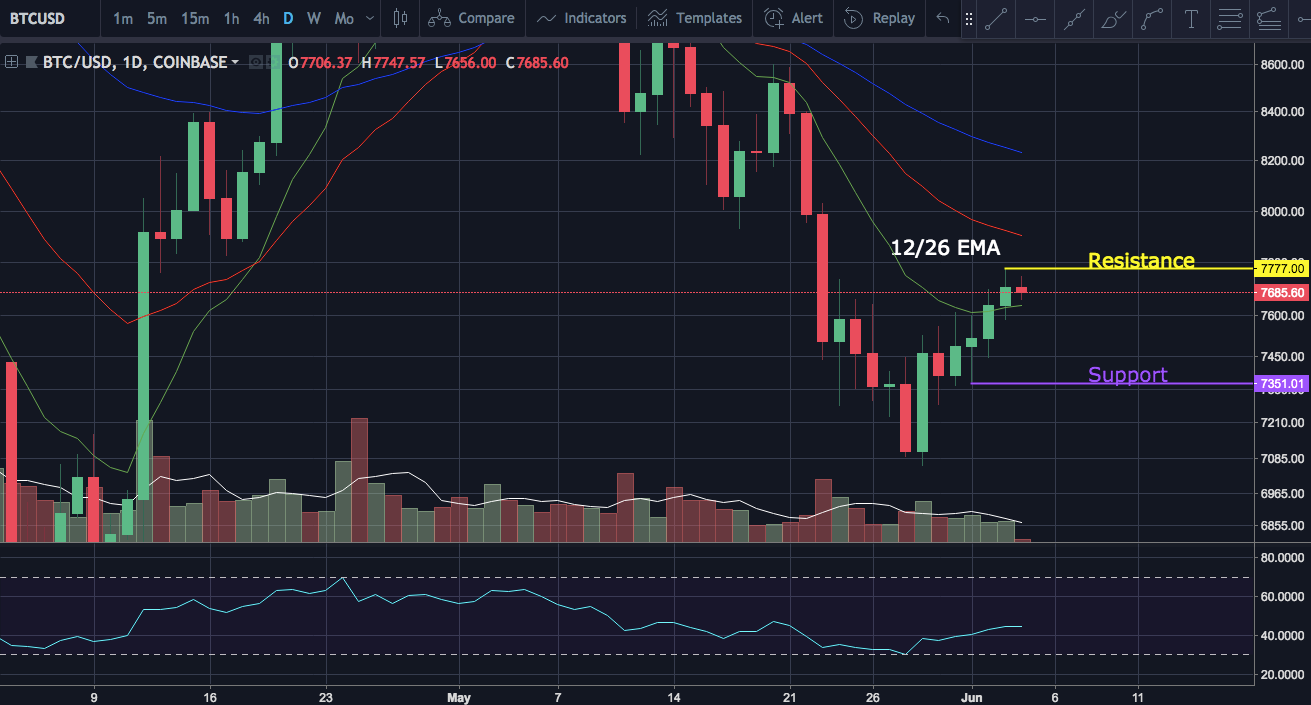
On the daily timeframe the bulls have climbed from the low of $7058 to back above the 12 day exponential moving average and we have now seen what may be the beginning of some consolidation on this time frame. We will be watching to see if we pull back to set a higher low on the daily chart before heading back up to set a higher high above $7777. The bulls will be looking to gain the 26 day exponential moving average as support now as well after already breaking above the 12 day.
Daily Chart
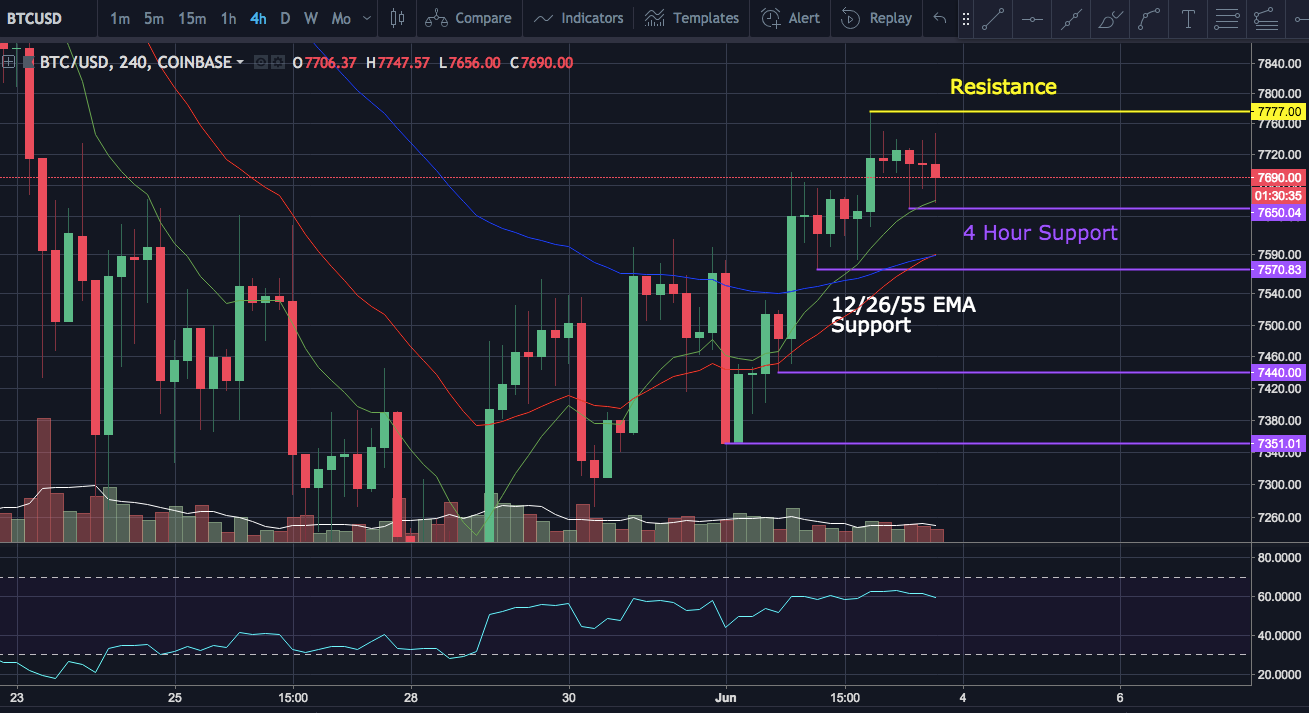
Bitcoin continues to make higher lows and higher highs on the 4 hour time frame. We now also have a bullish cross of the 12 and 26 exponential moving averages and the 26 EMA has almost climbed over the top of the 55 EMA as well. Current support levels on the 4 hour timeframe are $7650.04 and $7570.83. Keep in mind that we may lose the higher low pattern on the four hour timeframe if the bears push the price down to set a higher low on the daily chart.
4 Hour Chart