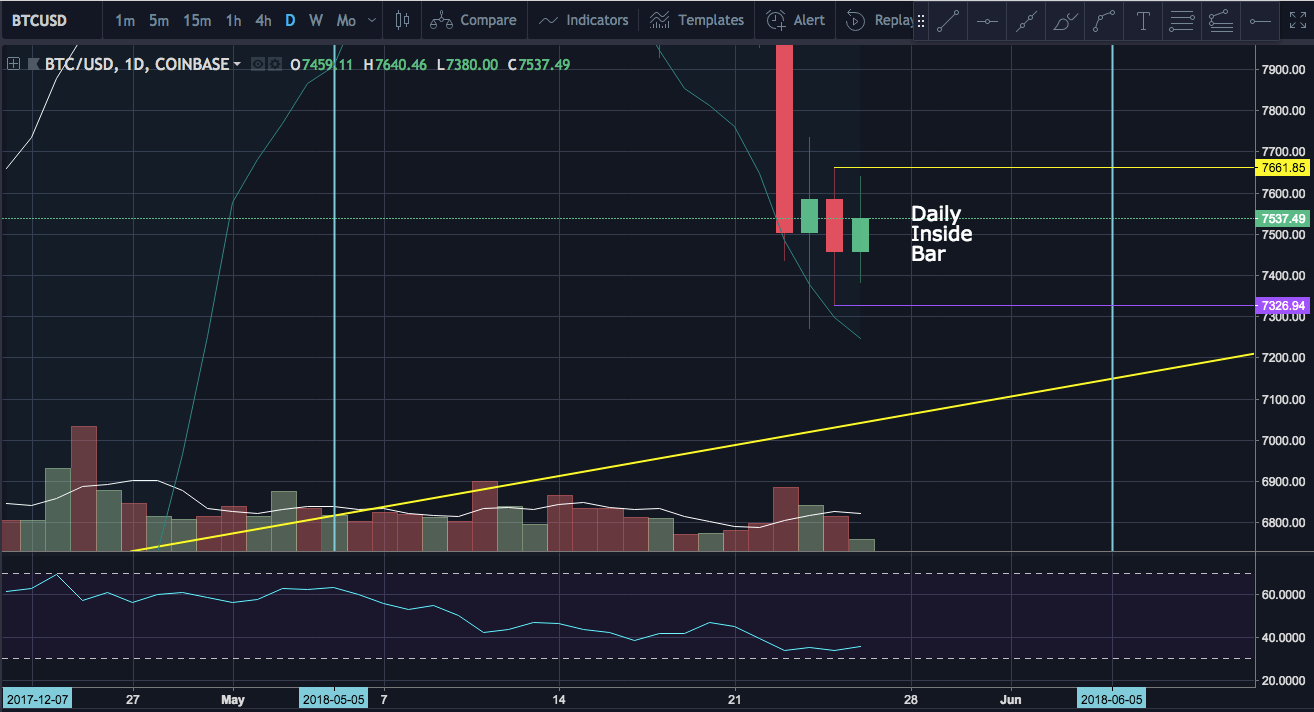
We are continuing to watch the weekly equilibrium pattern play out on Bitcoin as the bulls try to bounce from this recent dump. On the daily chart we currently have a second inside bar to be watching. A break of the high or low of the previous bar will provide a clear signal if we are going to continue the bounce or take another leg down toward $7,200.
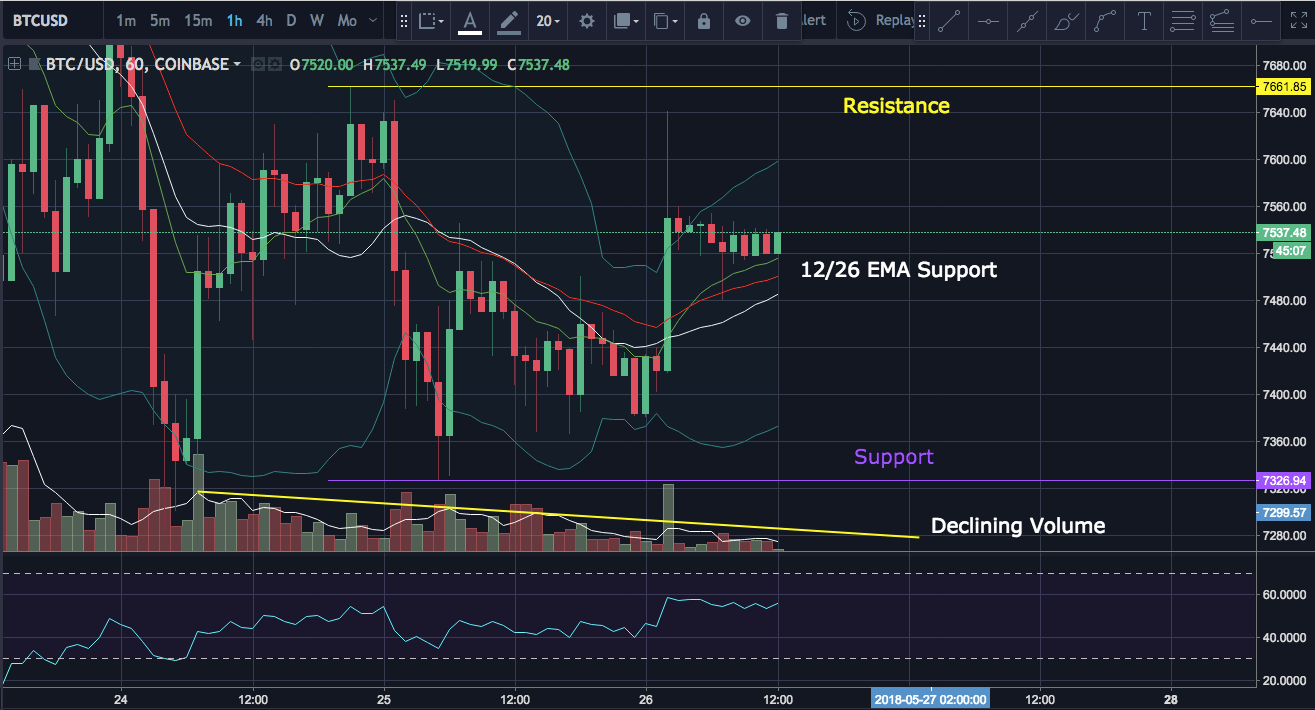
On the hourly timeframe the bulls have managed to break above the 12 and 26 period exponential moving averages and are currently riding them as support. These averages have crossed bullish on this timeframe.