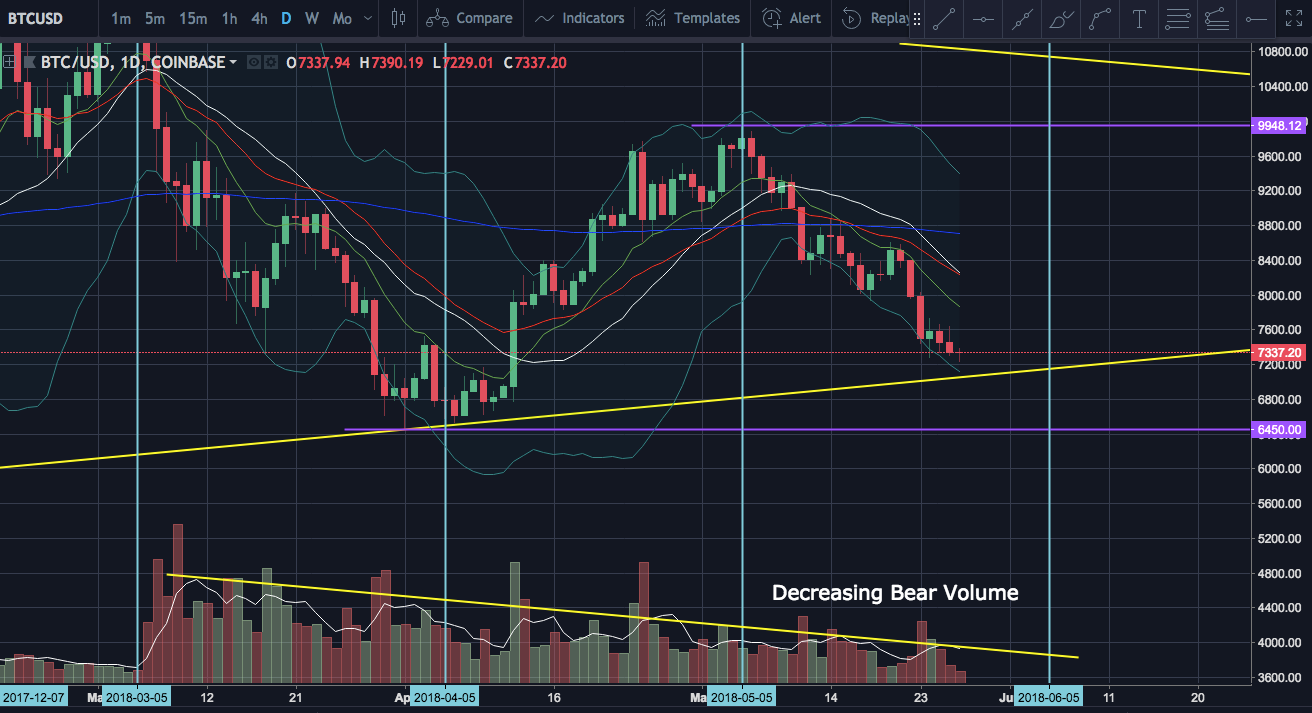
We have been watching the weekly equilibrium pattern play out on Bitcoin and are now looking for the bulls to establish a higher low compared to $6,450. Looking at the daily chart we can see decreasing bear volume, which is a good sign that a higher low will be set. If we get a flush below $7,000 the daily and 4 hour chart will be at oversold levels and I will be comfortable scaling in and looking for a volume climax and bounce. Otherwise a slow reversal would need to see the bulls regain the 12 and 26 hourly EMA support, followed by the 4 hour and then the daily.
Daily Chart: