After several days of bearish action with lower highs and lower lows the bulls have shown up and made a significant bounce attempt from the low of $7,058. We now have a bullish reversal candlestick on the daily time frame pointing to a signal that our higher low may be set in the weekly equilibrium pattern that we have been watching.
Daily Chart:
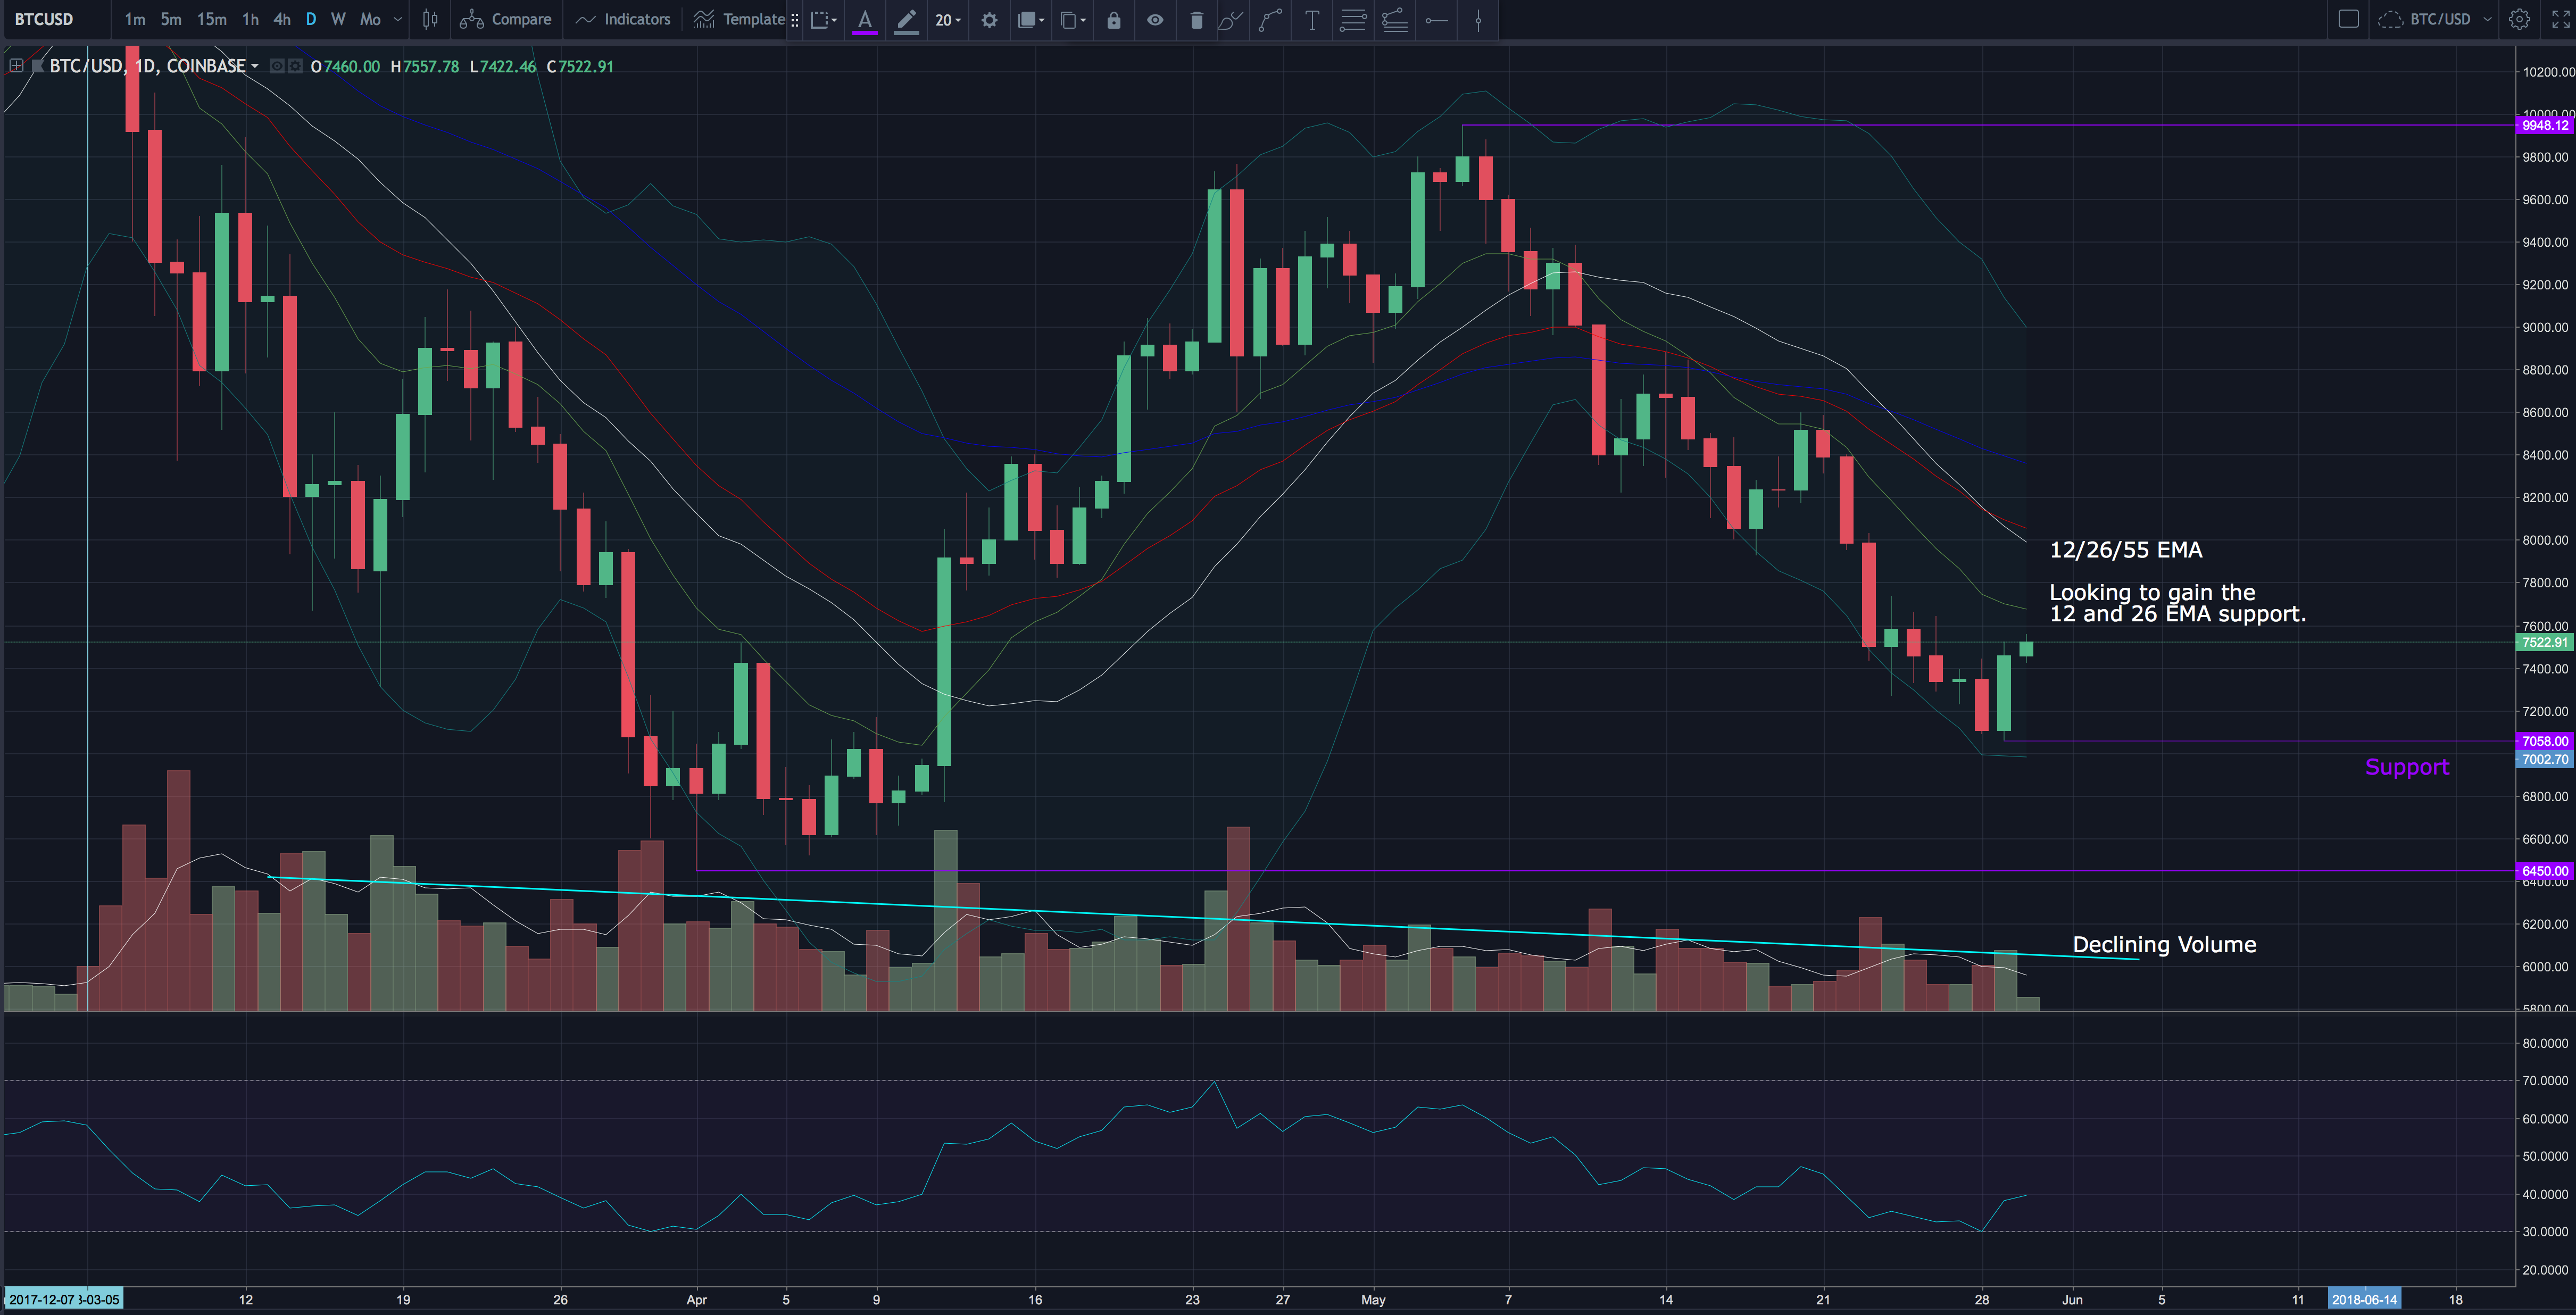
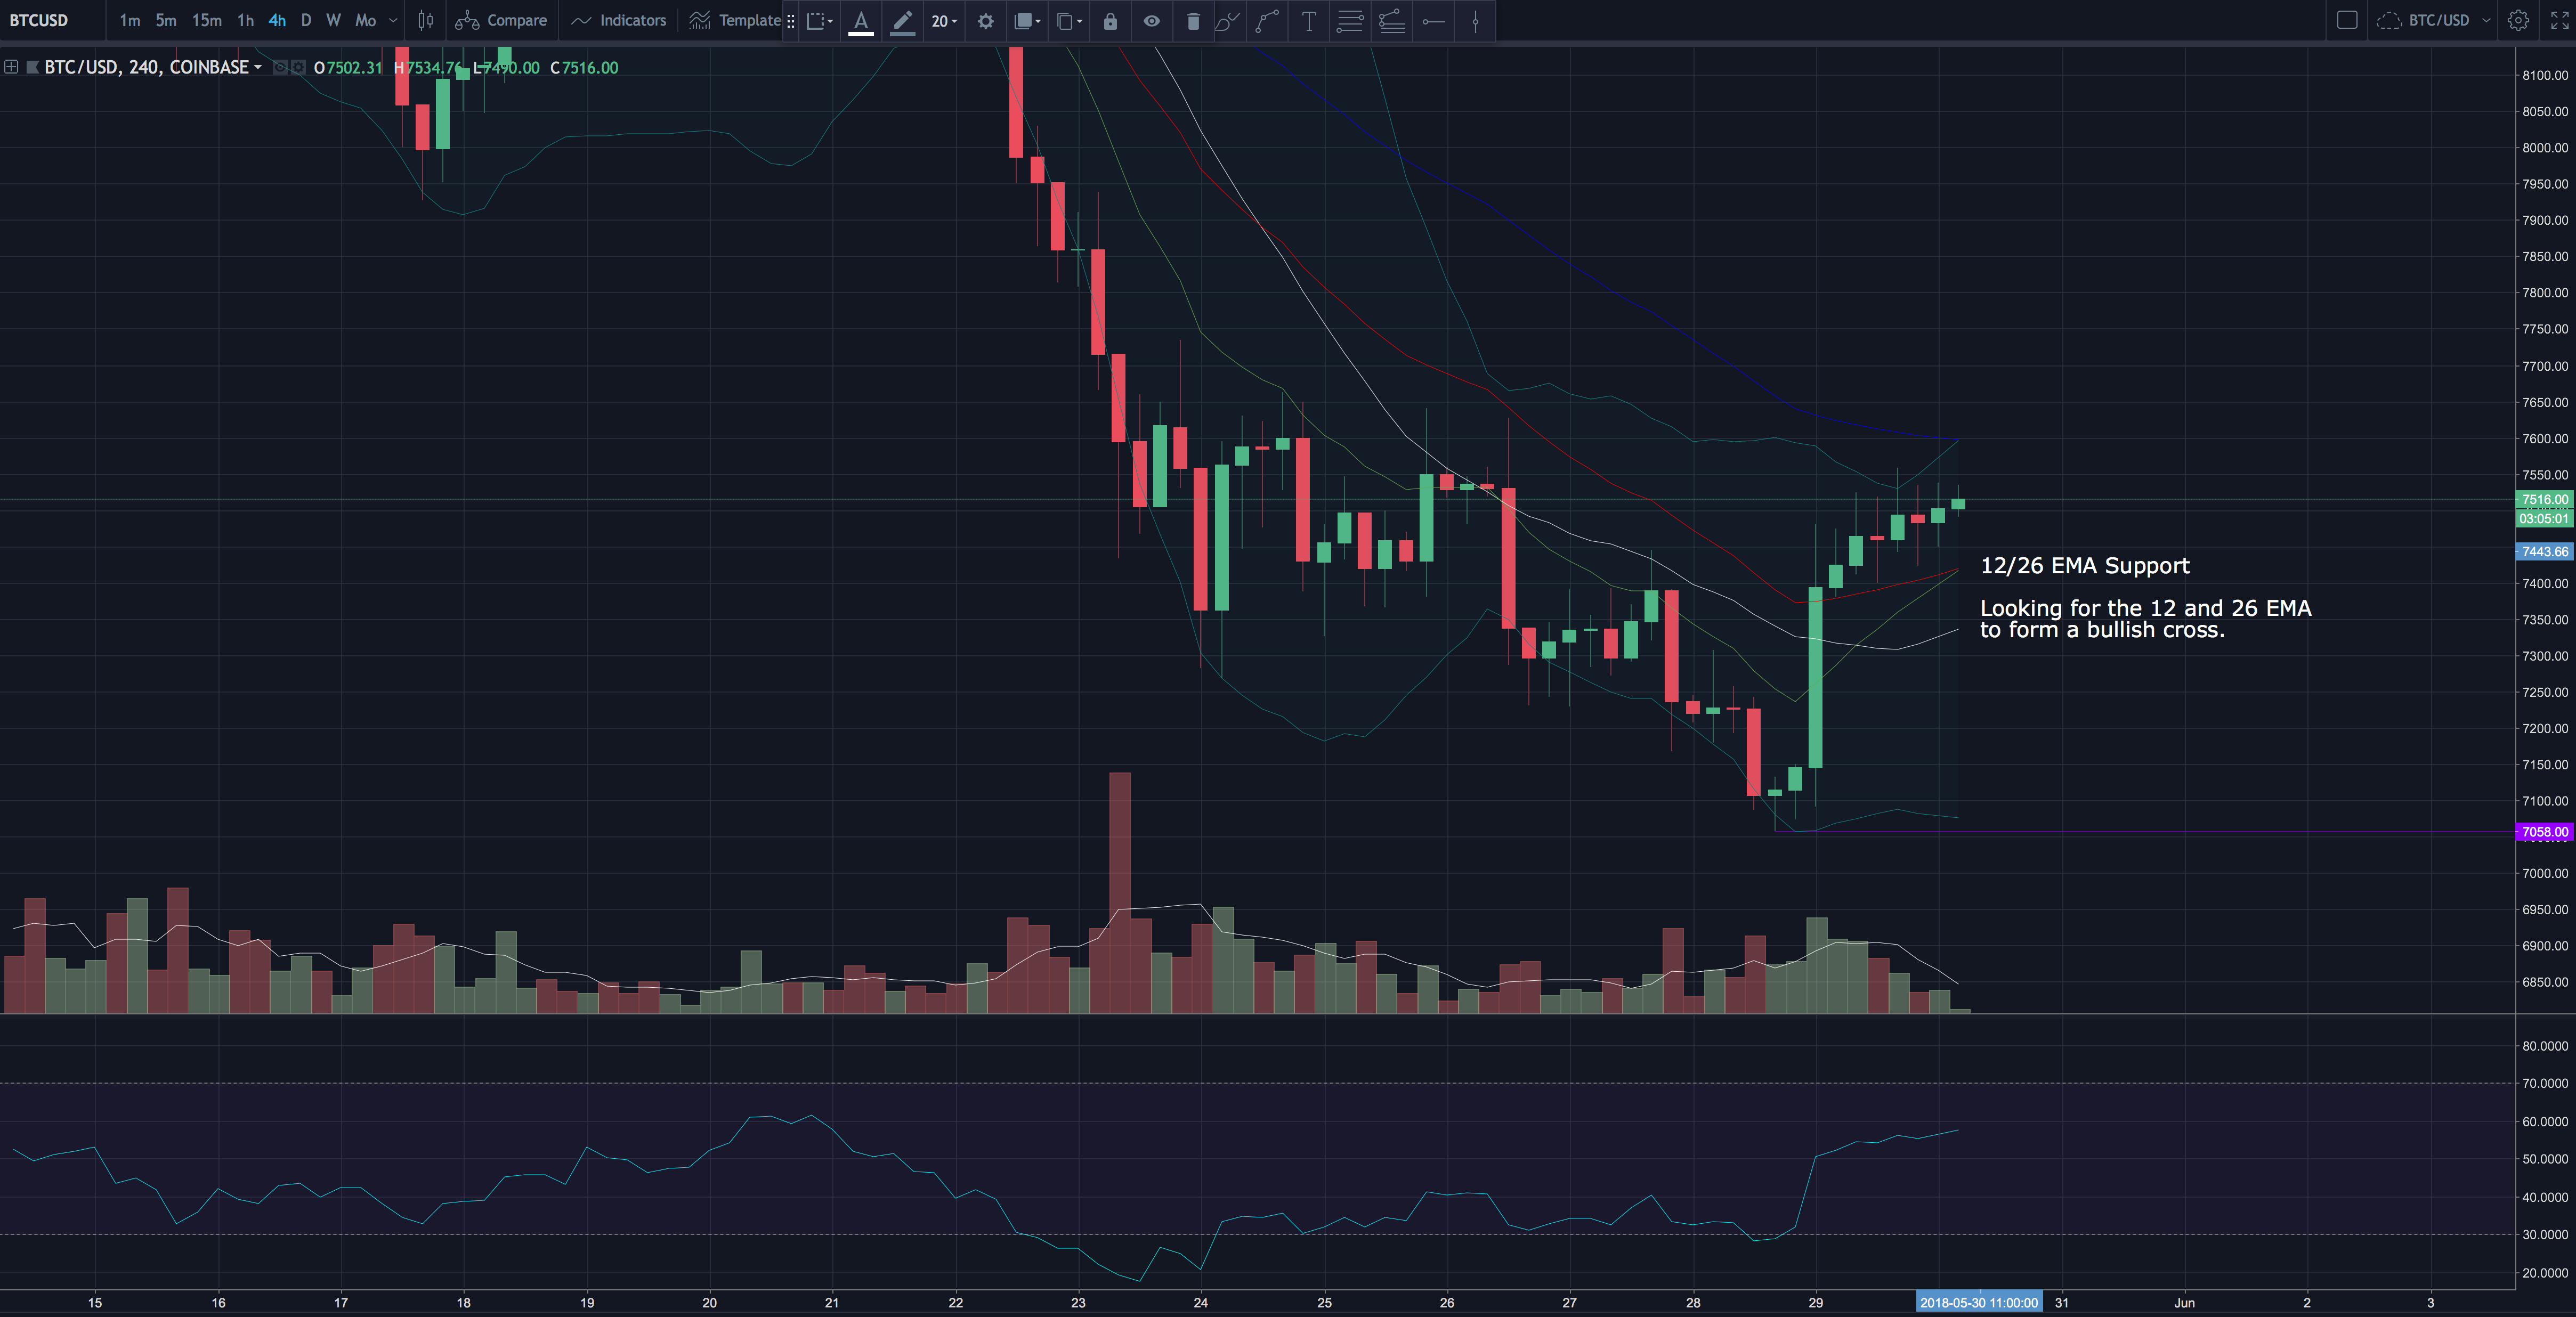
The bulls have been repeatedly rejected from the 12 and 26 period exponential moving averages the last several days. On this bounce attempt the bulls have been able to gain these EMA's as support now on the hourly and 4 hour time frames. We will now look for the bulls to gain a bullish cross of the EMA's on the 4 hour time frame and to gain the 12 and 26 EMA support on the daily chart.
4 Hour Chart: