Bitcoin had a dump this morning that created a lower low on the 4 hour time frame. This is a red flag that points to further daily consolidation. The risk to reward for entering a bullish trade at this level is not favorable in my opinion. We are continuing to watch for a pullback and to form an equilibrium pattern on the weekly timeframe.
Weekly Chart:
Weekly equilibrium scenario we are watching:
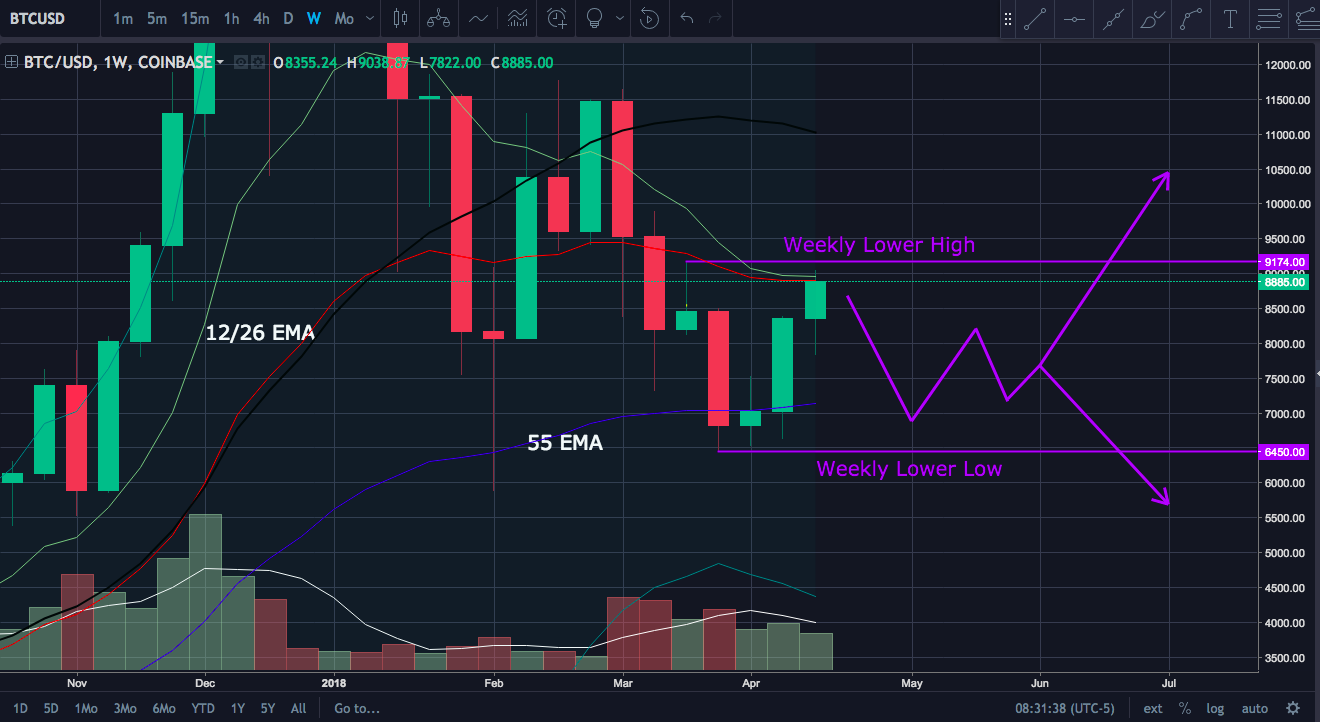
Weekly equilibrium scenario we are watching:
Daily Chart:
Looking at the daily chart there is a possibility of a cup and handle scenario playing out and breaking above the weekly lower high. However, this would be extremely bullish given how far the bulls have already come.
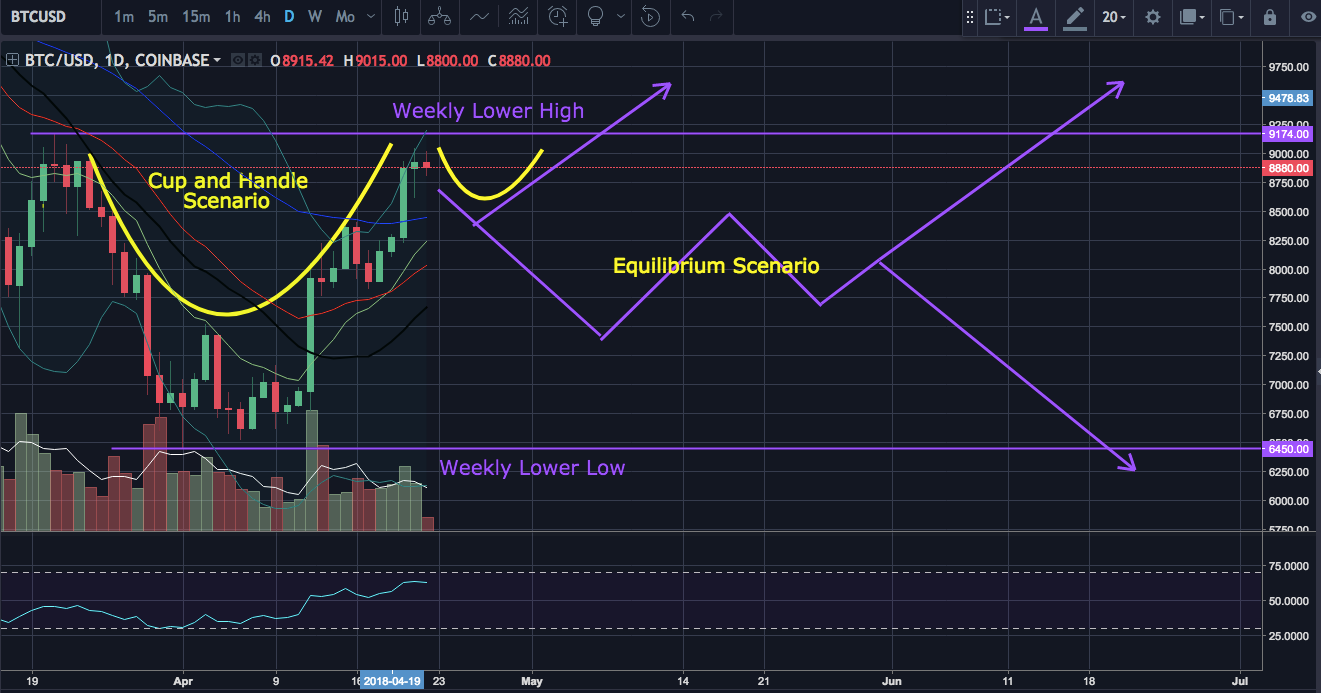
Looking at the daily chart there is a possibility of a cup and handle scenario playing out and breaking above the weekly lower high. However, this would be extremely bullish given how far the bulls have already come.
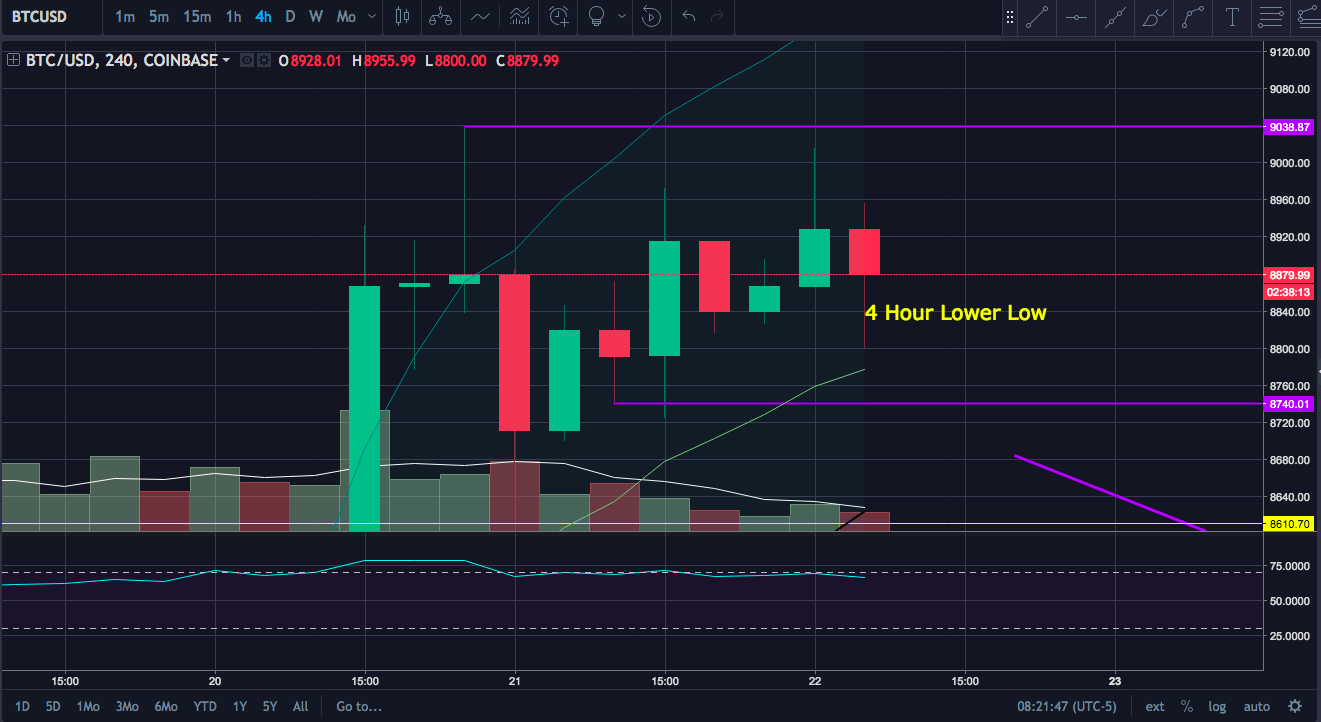
4 Hour Chart:
Bitcoin formed a 4 hour lower low. A red flag that points to daily consolidation. This supports both the cup and handle scenario and weekly equilibrium pattern we are watching for if it leads to further daily consolidation.
Bitcoin formed a 4 hour lower low. A red flag that points to daily consolidation. This supports both the cup and handle scenario and weekly equilibrium pattern we are watching for if it leads to further daily consolidation.
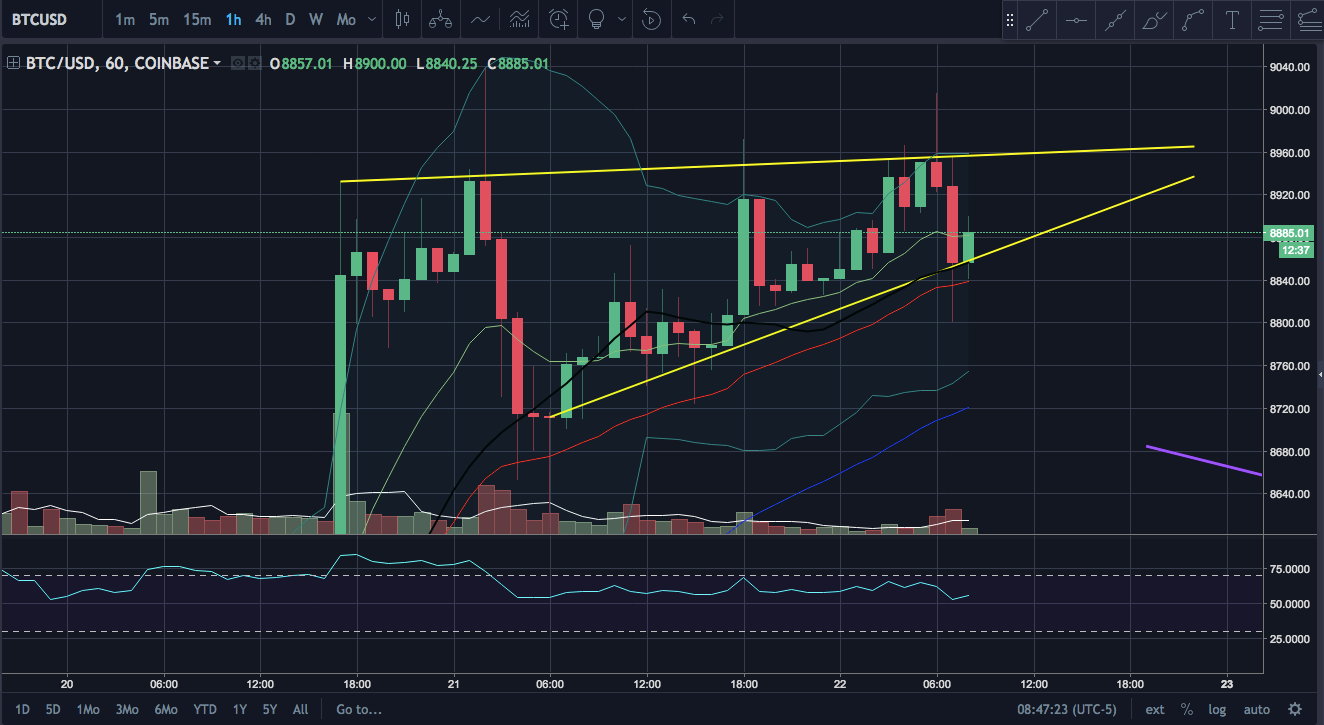
Hourly Chart:
On the hourly chart bitcoin is in a rising wedge. Be cautious here as bears may be top fishing with signs pointing to further consolidation on the longer time frames.