
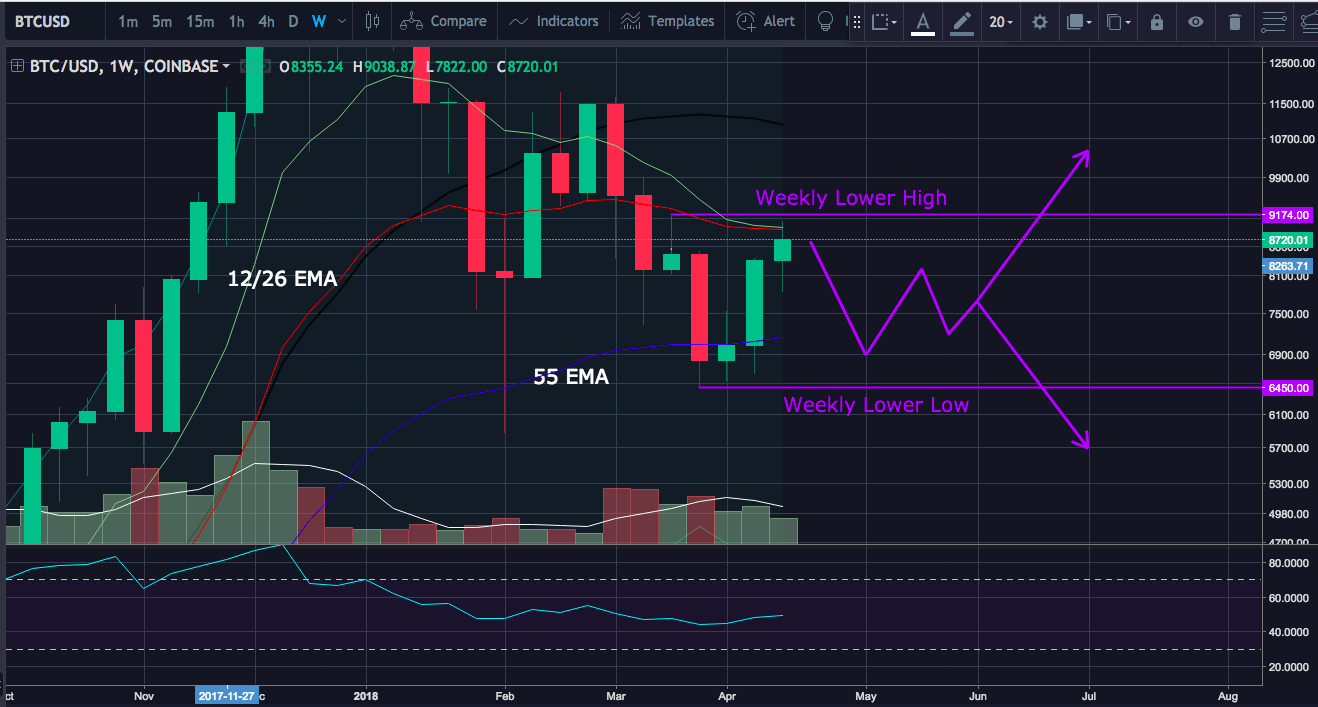
Weekly Chart:
We have reached the top of the potential weekly equilibrium pattern that we have been watching for and have started to pull back on this new daily candle. We are expecting bitcoin to continue to tighten up into this equilibrium pattern over the next month or two. A bull break of this weekly equilibrium could change the weekly trend bullish and test the all time high. A bear break of the equilibrium would keep the bears in control of the weekly chart.
We have reached the top of the potential weekly equilibrium pattern that we have been watching for and have started to pull back on this new daily candle. We are expecting bitcoin to continue to tighten up into this equilibrium pattern over the next month or two. A bull break of this weekly equilibrium could change the weekly trend bullish and test the all time high. A bear break of the equilibrium would keep the bears in control of the weekly chart.
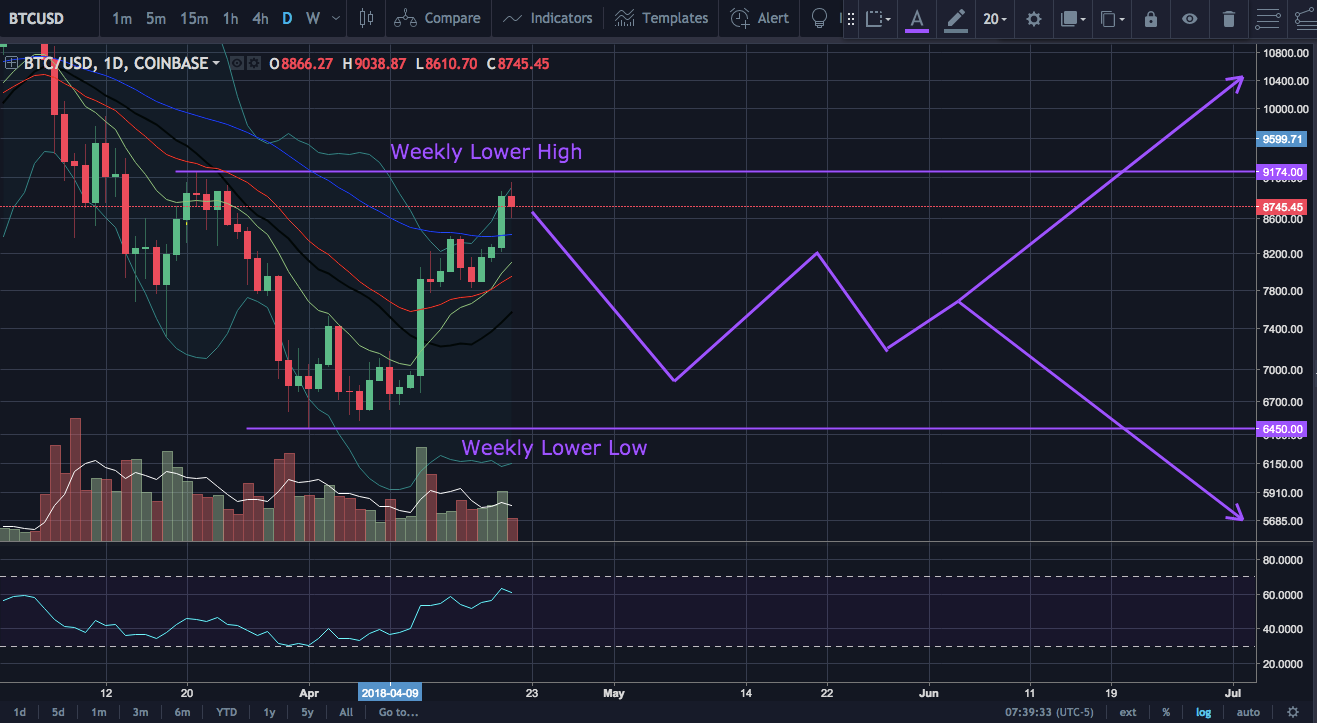
Daily Chart:
On the daily chart you can see that we have started to form a red bearish candle just under the resistance of the weekly lower high. This falls in line with the equilibrium scenario we are watching to play out.
On the daily chart you can see that we have started to form a red bearish candle just under the resistance of the weekly lower high. This falls in line with the equilibrium scenario we are watching to play out.
4 Hour Chart:
The higher low, higher high pattern is still in tact on the 4 hour chart. If we lose this pattern it will be a red flag for daily consolidation ahead.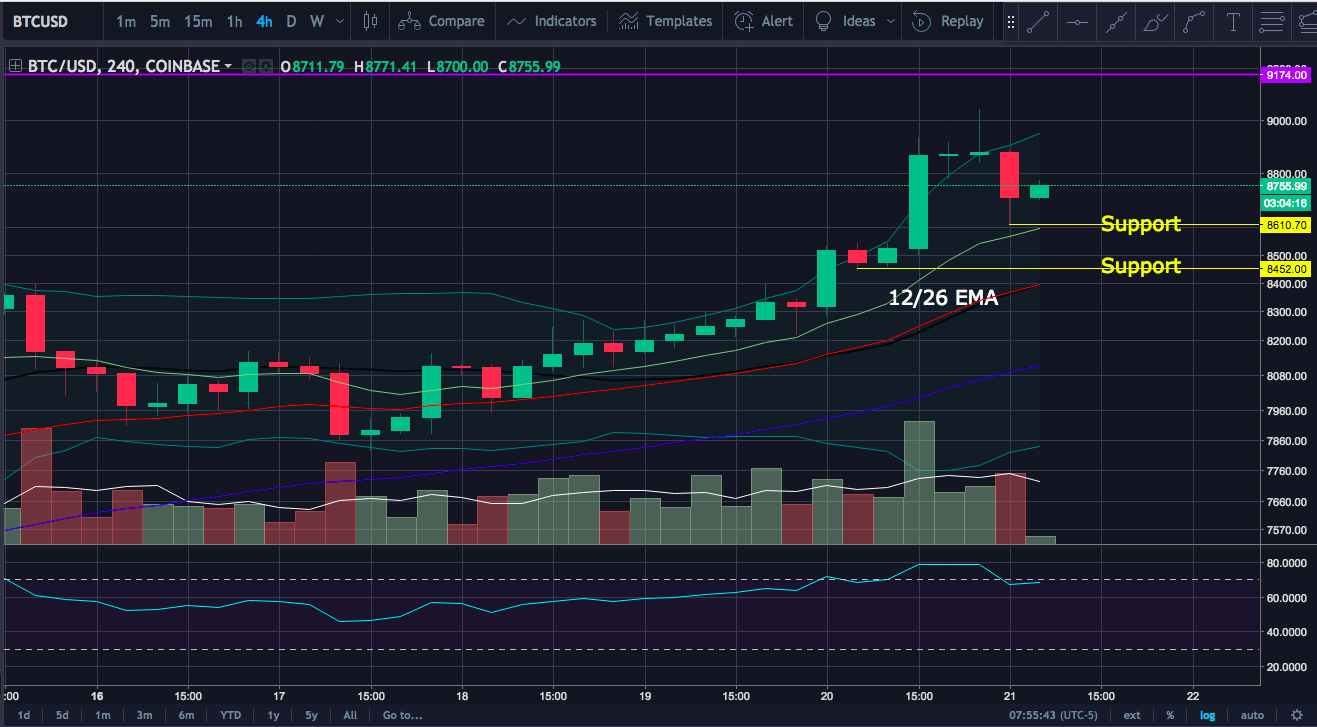
The higher low, higher high pattern is still in tact on the 4 hour chart. If we lose this pattern it will be a red flag for daily consolidation ahead.
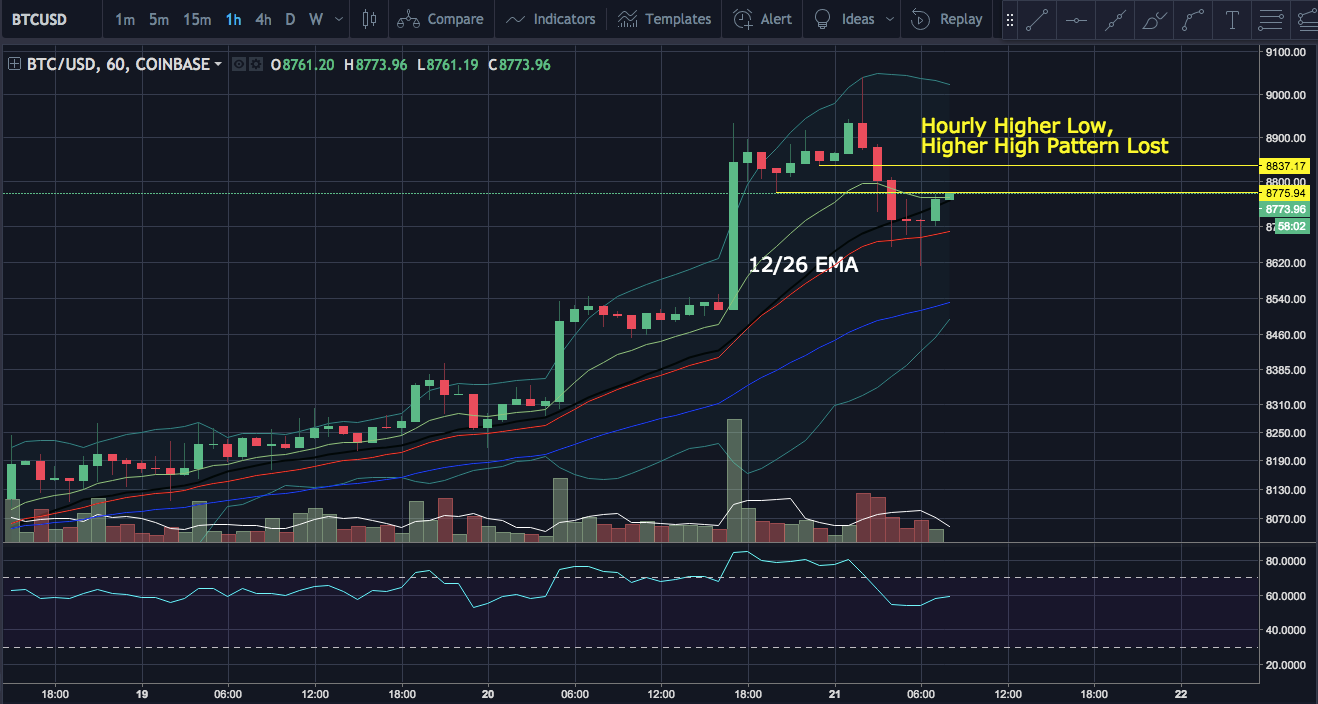
1 Hour Chart:
Bitcoin has lost the hourly higher low, higher high pattern and is now bouncing on the shorter time frames. After losing this pattern on the hourly chart the bulls should be cautious of losing the pattern on the 4 hour time frame, which would point to daily consolidation.
Bitcoin has lost the hourly higher low, higher high pattern and is now bouncing on the shorter time frames. After losing this pattern on the hourly chart the bulls should be cautious of losing the pattern on the 4 hour time frame, which would point to daily consolidation.