
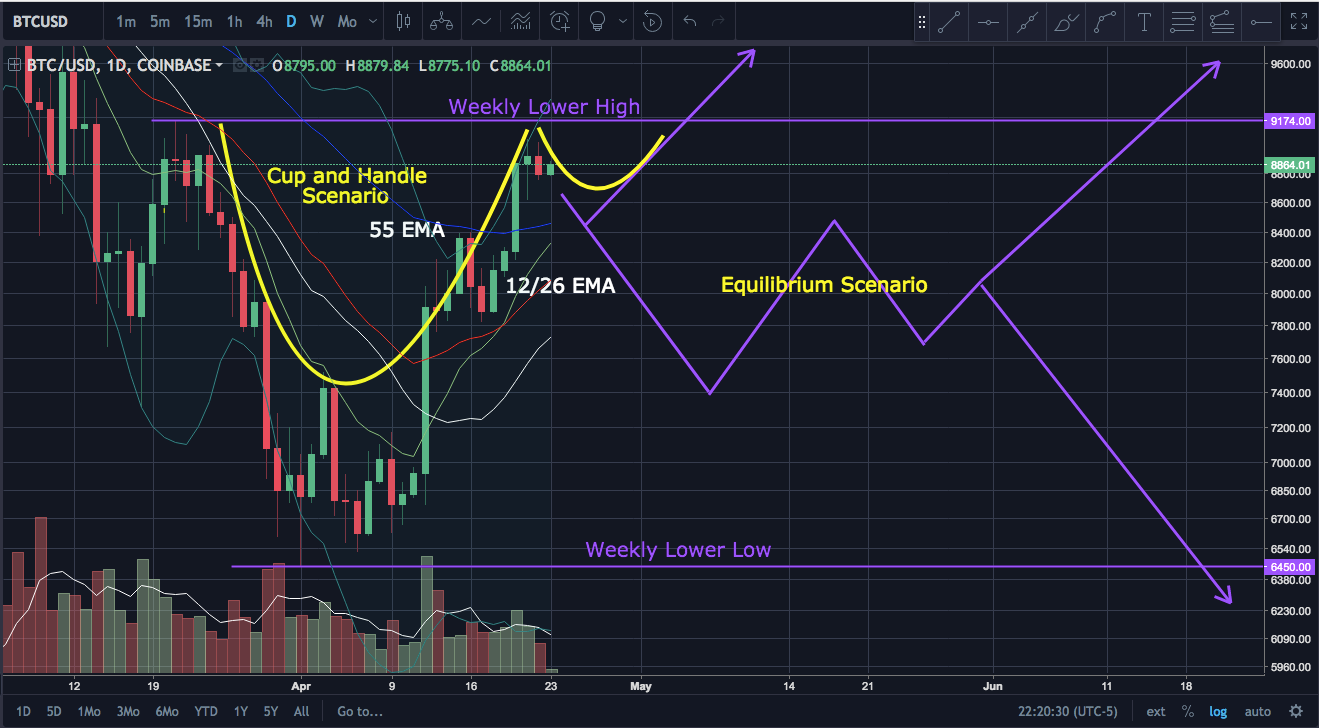
The tightening equilibrium pattern that we were watching on the shorter time frames has broken bearish and now Bitcoin has lost the higher low pattern on the 4 hour chart. As we pointed out earlier today this is a red flag pointing to more consolidation on the daily time frame. We will be watching the daily and weekly chart expecting a cup and handle pattern to play out if the bulls are strong. If the bears prove stronger we will look for a weekly equilibrium pattern to play out. Volume will be the key indicator to watch for clues
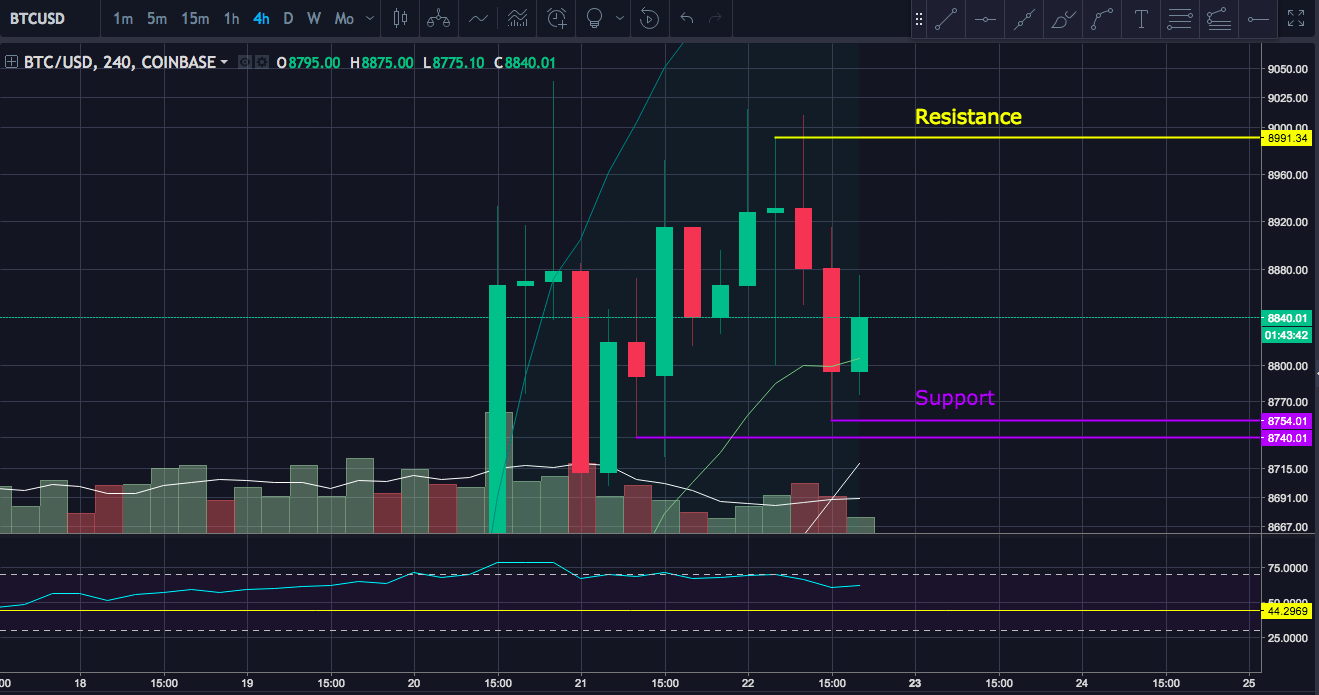
4 Hour Chart:
Support $8,754.01 and $8.740.01
Resistance $8991.34
Support $8,754.01 and $8.740.01
Resistance $8991.34
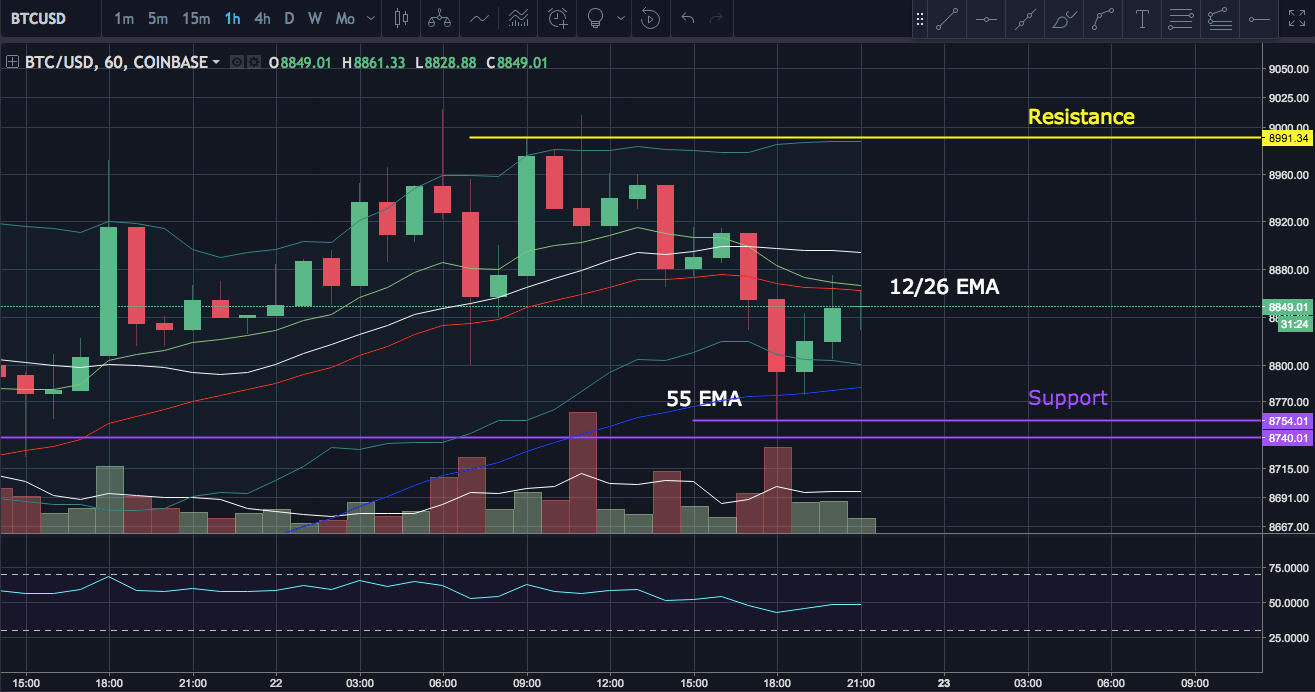
On the hourly chart Bitcoin has bounced from the support of the 55 exponential moving average. This may be a short lived bounce however as the 12 and 26 moving average are now acting as resistance along with the middle bollinger band (20MA). It is now up to the bulls to prove themselves as they will have to regain the higher high, higher low pattern on the 5, 15 and then hourly charts before they can turn the 4 hour chart back around.
Thanks for reading. If you find this helpful, please upvote and resteem this post and consider following me for more updates. Thanks!